
ABSTRACT
This report presents the Phase-2 implementation of an edge-AI based fault detection system for a DC–DC buck converter. The system uses a Tiva TM4C123GXL microcontroller to acquire voltage and current signals, extract statistical features in real time, execute an embedded decision-tree classifier, and report the detected operating state through an LCD, RGB LED, UART console and ESP8266-based Wi-Fi dashboard. Five operating classes were considered: idle, normal load, overload, short-circuit event and transient load switching. A total of 50 labelled CSV files were collected from the hardware setup. A decision-tree model trained on one-second windows achieved 99.6% accuracy on held-out files. The final implementation performs on-chip inference without a PC in the loop and streams compact prediction packets to a NodeMCU ESP8266 dashboard for live monitoring.
I.INTRODUCTION
Power electronic converters are widely used in embedded power supplies, battery-powered systems, motor drives and industrial electronics. Faults such as overload, short-circuit and abnormal load transients may cause voltage collapse, converter instability or thermal stress. Conventional protection circuits usually react only after a threshold is crossed and do not provide an intelligent label of the operating condition. Hence, a lightweight embedded fault classifier is useful for real-time monitoring.
This project implements an edge-AI based buck converter monitoring system using a Tiva TM4C123GXL micro-controller. The converter output voltage and current are sensed, features are computed locally, and a decision-tree classifier predicts the operating state. The result is displayed locally on an LCD and LED and is also transmitted through UART and Wi-Fi for remote visualization.
II.SYSTEM OBJECTIVES
The objectives of the implemented system are:
- Acquire converter voltage and current signals using the Tiva
- Generate labelled data for five converter operating
- Train a compact classifier suitable for bare-metal
- Execute inference directly on the
- Display predictions locally through LCD, RGB LED and UART
- Stream live prediction packets to a NodeMCU ESP8266
III.HARDWARE AND SOFTWARE USED
3.1 Hardware Components
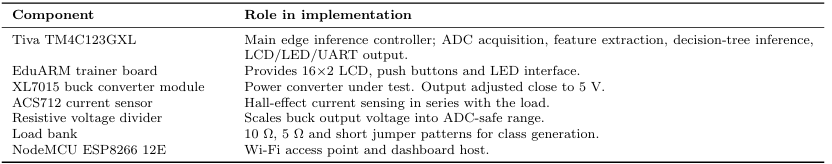
Table 1: Main hardware components used in the final setup
The XL7015 module is a ready-made non-isolated buck converter module. It was used instead of building the converter from scratch so that the project could focus on sensing, classification and embedded deployment.
3.2 Software Tools
The Tiva firmware was developed in Code Composer Studio using bare-metal C. Python and Google Colab were used for data logging, preprocessing, feature extraction, model training and rule export. Arduino IDE was used to program the NodeMCU ESP8266 dashboard firmware. The peripheral configuration and laboratory board usage were aligned with the DESE ESD-I embedded systems laboratory resources [1].
IV.HARDWARE ARCHITECTURE
The hardware architecture uses the XL7015 buck converter as the converter under test. Converter voltage is sensed through a DC resistive divider and current is sensed using the ACS712 module. The Tiva TM4C123GXL performs all inference locally, while the NodeMCU ESP8266 only receives UART5 packets and hosts the Wi-Fi dashboard.
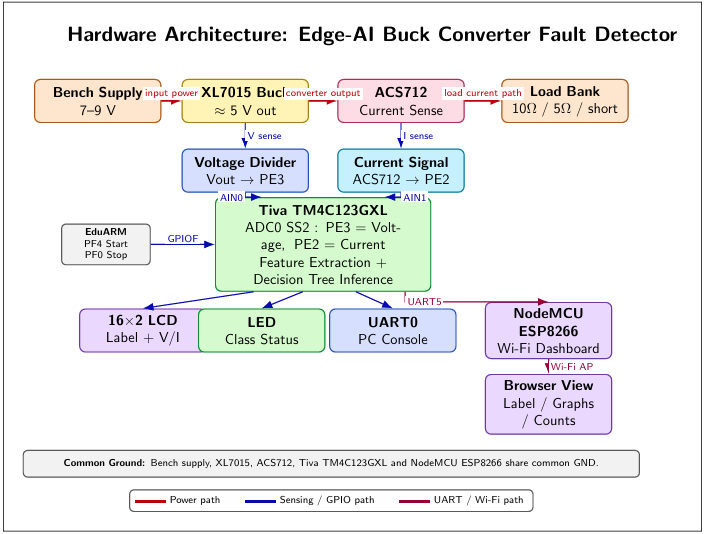
Figure 1: Hardware architecture of the implemented buck converter fault detection system
The power path is formed by the bench supply, XL7015 buck module, ACS712 current sensor and load bank. The sensing path feeds voltage and current signals into ADC0 SS2 of the Tiva. The output path drives the LCD, LED, UART0 console and UART5 transmission to the ESP8266 dashboard.
V.PIN MAPPING
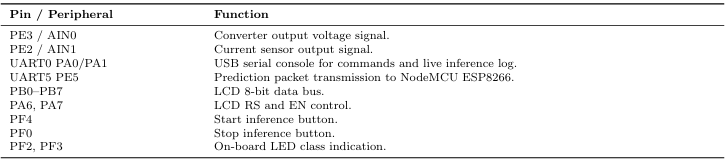
Table 2: Final TM4C123GXL pin mapping
VI.DATA COLLECTION AND METHODOLOGY
6.1 Class Definitions
Five operating classes were collected:
- idle: converter ON, no external
- normal: 10 Ω load connected throughout the
- overload: 5 Ω load connected throughout the
- short: short-duration jumper short
- transient: repeated press/release load switching
The steady-state classes were logged at 20 Hz for 15 s, giving 300 samples per run. The short-circuit class was captured at 50 Hz for 3 s, giving 150 samples per run, because short events are faster and require finer sampling.
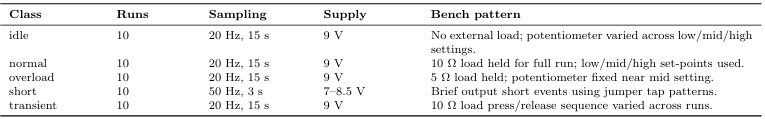
Table 3: Data collection plan followed for the five classes
6.2 Data set Summary
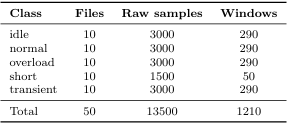
Table 4: Final data set statistics after windowing
The final dataset contained 50 CSV files and 13,500 raw samples. Feature extraction using one-second windows produced 1,210 labelled windows.
6.3 Observed Data Patterns
The idle class produced nearly constant voltage and current readings with low variation. The normal 10 Ω load showed a clear shift in current and slight voltage droop compared to idle. The overload 5 Ω case produced a stronger change in current and converter output. The short class produced sudden voltage collapse and recovery patterns. The transient class showed repeated switching between loaded and unloaded envelopes.
These characteristics motivated the use of simple statistical features rather than a heavy neural model. The class separation was largely captured by mean, range, min and max values of voltage and current.
VII.MODEL DEVELOPMENT
7.1 Feature Extraction
A one-second sliding window was used for each file. The step size corresponded to 50% overlap between adjacent windows. Eleven features were extracted:

These features are computationally light and map well to embedded implementation using sums, min/max opera-tions and sqrtf().
7.2 Classifier Selection
A decision-tree classifier was selected because it is easy to deploy on a microcontroller. The trained tree can be directly converted into nested C if rules without requiring a dedicated inference library. This made it significantly more practical than deploying a TensorFlow Lite Micro model for this project.
The final model used:
- DecisionTreeClassifier
- maximum depth = 6
- minimum samples per leaf = 8
- class weights = balanced
- grouped train/test split using file names as groups
Using grouped splitting prevents windows from the same CSV file from appearing in both training and test sets.
7.3 Model Accuracy and Feature Importance
The classifier achieved 99.6% accuracy on held-out files. Only one overload window was misclassified as normal. The most important features were i mean, v range, v max and v over i. These features are physically meaningful because load and fault changes directly affect current level, voltage droop and voltage range.
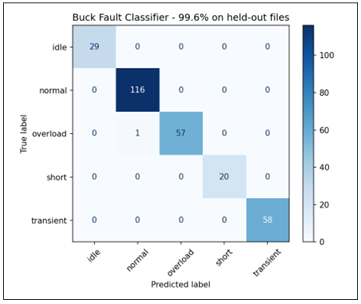
Figure 2: Confusion matrix for the decision-tree classifier on held-out files
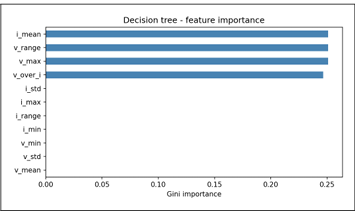
Figure 3: Decision-tree feature importance obtained from the trained model
VIII.EMBEDDED IMPLEMENTATION ON TIVA
8.1 Firmware Architecture
The firmware is organized as a real-time edge inference loop. SysTick provides the timing base. UART0 handles console commands and GPIOF handles local push-button control. ADC0 acquires voltage and current together. The feature engine computes the statistical features from a 20-sample buffer. The decision tree then produces the class label, and the result is sent to local and wireless outputs.
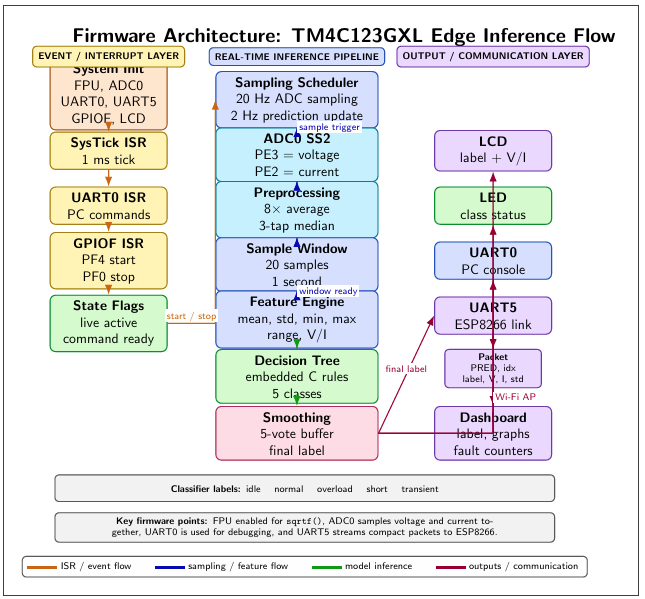
Figure 4: Firmware architecture of the TM4C123GXL edge-inference implementation
The key Phase-2 additions were FPU enablement, two-channel ADC acquisition on PE3 and PE2, filtering and windowing, embedded decision-tree rules, UART5 streaming to ESP8266, and PF4/PF0 start–stop control.
8.2 ADC and Timing
ADC0 sequencer SS2 was configured to acquire two channels together: PE3/AIN0 for voltage and PE2/AIN1 for current. Each logical sample is formed by averaging eight ADC conversions for noise reduction. A three-tap median filter is then applied before pushing the readings into a 20-sample circular buffer.
The sampling interval is 50 ms, corresponding to 20 Hz. Once the 20-sample feature window is filled, predictions are produced every 10 new samples. Hence the prediction update rate is approximately 2 Hz.
8.3 Use of FPU
The TM4C123GXL includes a floating-point unit. The firmware enables the FPU at startup because standard deviation computation uses sqrtf(). This allows the embedded feature engine to match the Python feature pipeline more closely.
8.4 Interrupts and Interfaces
The firmware uses:
- SysTick Handler() for millisecond timekeeping,
- UART0 Handler() for command reception,
- GPIOF Handler() for PF4 start and PF0 stop handling,
- ADC0 SS2 for paired voltage/current
UART0 is dedicated to the PC console, while UART5 is used only for the ESP8266 communication link. This separation makes debugging and dashboard streaming independent.
8.5 Prediction Packet Format
The packet sent from Tiva to NodeMCU over UART5 is:
PRED,index,label,v mean,i mean,i std
For example:
PRED,516,idle,2475,1350,0
This compact ASCII format is easy to parse on the ESP8266 and also easy to inspect during debugging.
IX.DEPLOYMENT AND DEMONSTRATION
The final deployment contains the Tiva TM4C123GXL, EduARM LCD interface, XL7015 buck converter, ACS712 current sensor, load resistors and NodeMCU ESP8266. The Tiva board performs inference and updates the LCD, UART console and ESP8266 dashboard simultaneously.
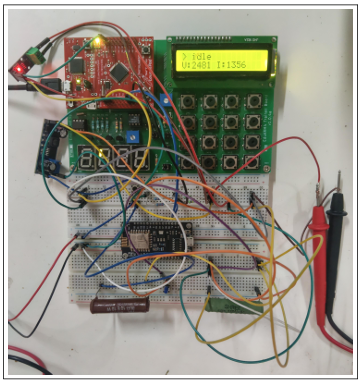
Figure 5: Final hardware setup used for live converter fault detection
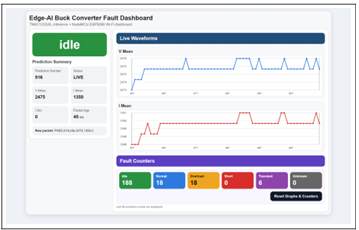
Figure 6: ESP8266 dashboard showing live label, waveform trends and counters
The UART console used during live testing is shown in Fig. 7. It prints the prediction index, detected label and selected features in real time.
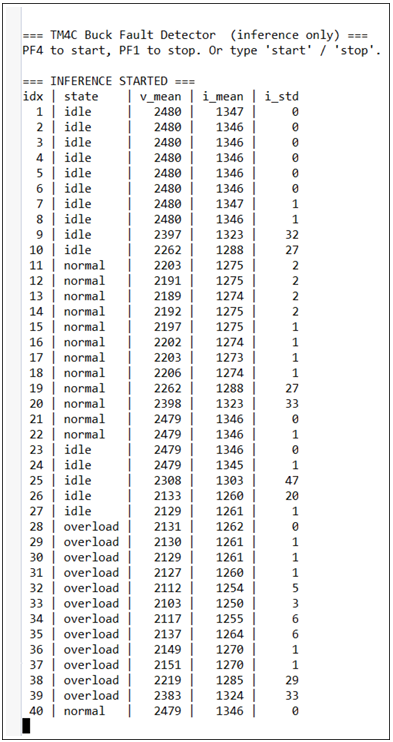
Figure 7: UART0 console output during live inference
X.RESULTS
The final system demonstrated three simultaneous output modes:
- Local output: predicted class and feature values shown on the
- Debug output: continuous UART0 inference
- Wireless output: live dashboard through NodeMCU
The decision-tree classifier achieved 99.6% accuracy on held-out files. During live testing, class changes were visible on the LCD, UART console, LED indication and dashboard. Idle, normal and overload states were reliably distinguished through voltage and current feature patterns. Short and transient classes were captured as event-driven patterns and depended more strongly on how the manual event was introduced.
XI.IMPLEMENTATION METRICS
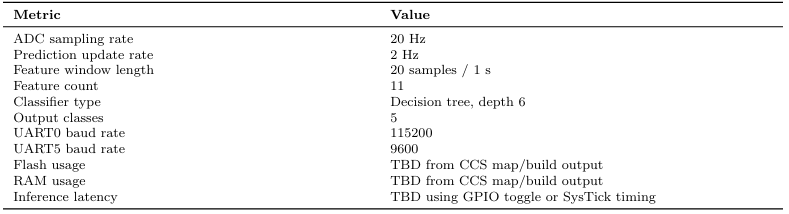
Table 5: Implementation metrics. Replace TBD values after final measurement if required
Flash and RAM usage can be taken directly from the CCS linker map file. Inference latency can be measured by toggling a spare GPIO before and after inference or by printing timestamp differences using the SysTick timer.
XII.KEY ENGINEERING DECISIONS
Important engineering choices in Phase 2 were:
- using a ready-made XL7015 module instead of designing a buck converter from scratch,
- replacing the AC-oriented ZMPT101B approach with a resistive divider for DC voltage sensing,
- choosing a decision tree instead of a neural network for easy bare-metal deployment,
- separating UART0 and UART5 for debug and Wi-Fi communication,
- enabling the TM4C FPU for embedded feature
XIII.LIMITATIONS
The present setup is a laboratory prototype. Some classes, especially short and transient, are generated manually using jumper or button actions and are therefore not perfectly repeatable. The dataset is bench-specific and depends on the converter, wiring, supply and load arrangement. The trained model may need recalibration if the hardware setup is changed.
XIV.FUTURE WORK
Possible future extensions are:
- adding a MOSFET-based or electronic-load based repeatable fault injector,
- collecting a larger dataset across more voltage and load settings,
- adding converter input voltage as an additional feature,
- automating session logging and dashboard export,
- evaluating long-term robustness under continuous
XV.CONCLUSION
An end-to-end edge-AI based fault detection system for a buck converter was implemented using the Tiva TM4C123GXL. The system acquires voltage and current data, computes lightweight statistical features, classifies five operating states using an embedded decision tree, and reports the result locally and wirelessly. The final implementation demonstrates that useful real-time intelligence for power converter monitoring can be achieved directly on a microcontroller without cloud-based inference.
REFERENCES
- Department of Electronic Systems Engineering, Indian Institute of Science, “ESD-I — Embedded Systems,” DESE Embedded Systems Laboratory. Available: https://labs.dese.iisc.ac.in/embeddedlab/esd-i/. Accessed: May 2026.
- HandsOn Technology, “XL7015 Wide Range Input Voltage 5–80V DC–DC Converter Data Specs,” XL7015 module
- Texas Instruments, “TM4C123GH6PM Microcontroller Data Sheet,” Tiva C
- Espressif Systems, “ESP8266EX Datasheet,” Espressif
- Scikit-learn Developers, “DecisionTreeClassifier,” scikit-learn documentation.
Recent Comments