
ABSTRACT
This report presents the design and implementation of an IoT-based Multi-Parameter Environmental Monitoring System built around the Texas Instruments TM4C123GXL (ARM Cortex-M4) microcontroller. The system integrates three heterogeneous sensor modalities onto a shared I2C bus and ADC peripheral: the Bosch BME680 measures ambient temperature, relative humidity, barometric pressure, and gas resistance (from which an Indoor Air Quality index is derived); the Lite-On LTR-390 senses ambient visible light intensity and ultraviolet radiation index; and the Maxim Integrated MAX4466 electret microphone amplifier provides analogue sound-pressure level estimation via ADC peak-to-peak detection. All processed sensor readings are presented locally in real time on a BOOSTXL-K350QVG-S1 320×240 SPI TFT BoosterPack mounted on the LaunchPad, and are simultaneously transmitted over UART1 at 115 200 baud to an ESP8266 NodeMCU running the Arduino Blynk library, which publishes eight telemetry channels to the Blynk IoT cloud platform in real time. The entire node is powered through an LM2596 step-down DC–DC converter that accepts a wide input range (1.3–37 V) and regulates a stable 5 V/3.3 V rail to the LaunchPad and sensors, allowing the system to be powered interchangeably from a USB power bank, a standard mobile phone charger, or a bench laboratory power supply. A secondary UART0 debug console streams formatted readings at 115 200 baud to a host PC. The hardware architecture, power subsystem, firmware design, sensor characterisation, local display rendering, cloud integration, and live dashboard are described in full. Representative readings captured on the BoosterPack TFT, the Blynk web console, and the Blynk mobile application are presented and discussed.
I.INTRODUCTION
The Mandelbrot Indoor environmental monitoring has become increasingly important in applications ranging from smart building automation to personal health management and industrial hygiene. A practical IoT monitor must simultaneously acquire data from multiple physical phenomena, process it with sufficient accuracy for actionable insight, present it locally for immediate visibility, and deliver it to a remote dashboard with low latency and minimal user friction.
This project addresses that requirement by combining a capable ARM Cortex-M4 microcontroller with a carefully chosen sensor suite, a colour TFT BoosterPack for at-the-node visualisation, and a commercially available cloud IoT platform. The TM4C123GXL (Tiva C LaunchPad) handles all time-critical acquisition and computation tasks, drives the local Kentec QVGA display through SPI using the TivaWare grlib graphics library, and delegates wireless connectivity to a co-processor ESP8266 that runs the established Blynk stack. This separation of concerns yields clean firmware partitioning: the TM4C123 focuses on deterministic sensor sampling, on-board rendering, and packet formatting, while the ESP8266 manages Wi-Fi association, TCP connection keep-alive, and cloud message serialisation.
The chosen sensor suite provides complementary coverage of the indoor environment: thermal comfort (temperature and humidity), atmospheric pressure for altitude awareness, air quality via volatile organic compound proxy (gas resistance), photometric and ultraviolet radiation for lighting and UV safety assessments, and acoustic noise level for workplace or sleep environment characterisation. Together these channels give a comprehensive environmental fingerprint from a single embedded node.A flexible power front-end based on the LM2596 buck regulator allows the same hardware to be deployed in three common scenarios — at a workbench using a regulated lab supply, on the desk using a phone charger, or in a portable configuration using a USB power bank — without any wiring changes, because the LM2596 module accepts any DC source from approximately 4 V up to 40 V and regulates it down to the 5 V required by the LaunchPad.
II.SYSTEM ARCHITECTURE
2.1 Hardware Architecture
The system follows a three-block architecture: a sensing/processing block built around the TM4C123GXL, a local presentation block based on the BOOSTXL-K350QVG-S1 BoosterPack, and a wireless uplink block consisting of an ESP8266 NodeMCU running the Blynk firmware. The TM4C123GXL serves as the primary controller, handling all I2C communication with the BME680 and LTR-390 sensors, ADC acquisition from the MAX4466, formatting of debug output to UART0, packetising sensor data to UART1 for the ESP8266, and driving the SSD2119 TFT controller over SPI through the TivaWare grlib graphics library. The ESP8266 NodeMCU acts as a wireless co-processor, receiving comma-delimited packets from the TM4C123 on its hardware UART (RX0) and forwarding each value to the corresponding Blynk virtual pin via the Blynk cloud API.
2.2 Bus and Peripheral Assignment
I2C0 is mapped to PB2 (SCL) and PB3 (SDA) at 100 kbps in standard mode. Both the BME680 and LTR-390 share this bus with fixed 7-bit addresses (0x76 and 0x53 respectively). The Bosch BME68x official API bridges TivaWare’s low-level I2C master driver to the read/write function pointers required by the library. ADC0 Sequencer 3 is configured for single-sample software-triggered operation on AIN0 (PE3) at 12-bit resolution for the MAX4466. UART1 (PB0 RX / PB1 TX) carries the outgoing sensor packet to the ESP8266. UART0 (PA0/PA1) carries the UARTprintf debug stream to a host terminal. The BOOSTXL-K350QVG-S1 BoosterPack uses SSI/SPI together with a small set of GPIO control lines for the SSD2119 controller, configured by the Kentec320x240x16_SSD2119Init() driver shipped with the BoosterPack. Critically, because the TFT BoosterPack and the I2C sensors both occupy parts of GPIO Port B, the firmware initialises the display first and the I2C subsystem second; this guarantees that the I2C pinmux on PB2/PB3 is not accidentally overwritten by the display driver’s late initialisation of unrelated PB pins.
2.3 Power Subsystem
The system is powered through an LM2596-based step-down (buck) DC–DC converter module with an integrated voltage display and an adjustable potentiometer. The module accepts any DC input from approximately 4 V to 40 V and produces a regulated output of 1.3 V – 37 V, set in this design to 5.0 V to match the TM4C123 LaunchPad’s USB-equivalent rail. This regulated 5 V is fed into the LaunchPad’s 5 V input pin; the LaunchPad’s on-board LDO then provides 3.3 V to the MCU and to all three sensor modules. Because the converter accepts a wide input range, the same hardware can be powered without modification from any of three common sources:
USB power bank (5 V nominal): for portable / mobile deployments.
Phone charger (5 V USB or 9–12 V DC barrel): for desk-top operation.
Bench laboratory power supply (typically 5–12 V DC): for development and instrumented testing.
The module’s on-board 7-segment voltmeter is used to verify the regulated output before connecting the LaunchPad. Total system current draw at idle is dominated by the ESP8266 (≈70–80 mA average, with bursts to ≈200 mA during Wi-Fi transmission); the three sensors collectively consume under 2 mA, and the BOOSTXL-K350QVG-S1 backlight draws on the order of 50–80 mA. A 2000 mAh USB power bank therefore provides several hours of continuous operation
2.4 System Data Flow
Every measurement loop iteration (≈2 s) the firmware executes the following pipeline:
- ReadBME680() — triggers forced-mode measurement, waits for the heater profile to complete, retrieves compensated temperature/humidity/pressure/gas resistance, and derives an IAQ score from a piecewise gas-resistance
- ReadLTR390_ALS() — switches the LTR-390 to ALS mode, waits for integration, reads three bytes of 20-bit ambient light data, and converts to lux.
- ReadLTR390_UV() — switches the LTR-390 to UVS mode, waits for integration, reads three bytes of 20-bit UV data, and divides by the sensor sensitivity factor (2300 counts per UVI unit).
- ReadMAX4466() — executes three 64-sample peak-to-peak measurement bursts at ~4 ms sample intervals, takes the median to reject transient spikes, and maps peak-to-peak ADC counts to a calibrated dB estimate via a stepped lookup
- UpdateTFTDisplay() — clears the value column on the BoosterPack TFT and re-renders all eight live readings using the grlib graphics primitives.
- SendDataToESP() — serialises all eight global variables into a comma-separated ASCII packet (temp, hum, pres, iaq, als, uvi, sound, gas_kΩ) terminated by ‘\n’ and clocks it out byte-by-byte on UART1.
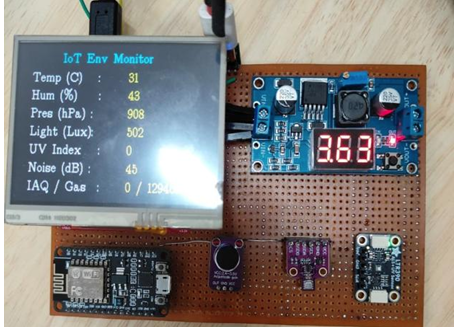
Figure 1- Hardware Setup
III.HARDWARE PHOTOGRAPHS AND CLOUD DASHBOARD
The following figures capture the assembled hardware and the live cloud dashboards in operation.
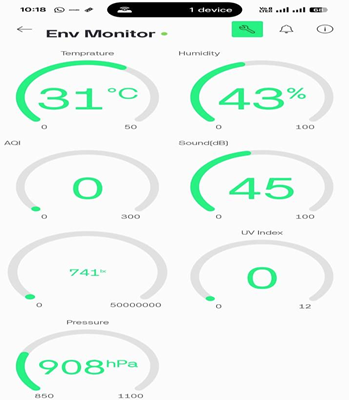
Figure 2 — Blynk Mobile App UI (Android/iOS) showing live telemetry
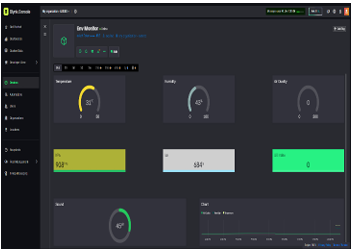
Figure 3 — Blynk Web Console dashboard with all eight virtual pins active
VI.SENSOR CHARACTERIZATION
4.1 Bosch BME680 – Environmental Sensor
The BME680 integrates four measurement elements in a single 3×3 mm LGA package. Temperature is sensed by an embedded silicon bandgap element and compensation corrected using a 42-coefficient calibration dataset stored in on-chip OTP. Relative humidity is measured capacitively. Pressure is sensed piezo resistively. Gas resistance is measured by applying a controlled heater pulse to a metal-oxide sensing element and recording the resistance at equilibrium; higher resistance correlates with cleaner air as oxidising VOCs reduce the surface conductance.
In this implementation the BME680 is operated in forced mode: the firmware sets the operating mode register, waits for the measurement duration plus heater duration, and then reads the result registers. The heater profile is fixed at 300°C for 100 ms. The oversampling configuration is OS_TEMP×2, OS_PRES×1, OS_HUM×16. Both the gas valid (BME68X_GASM_VALID_MSK) and heater-stable (BME68X_HEAT_STAB_MSK) flags are checked before the gas reading is consumed; if either flag is clear, IAQ is reported as invalid (-1) so that the consumer can suppress display of stale or transient values.
4.1.1 IAQ Derivation from Gas Resistance
True IAQ computation requires the closed-source Bosch BSEC algorithm, which performs multi-hour baseline learning and humidity-compensated VOC quantification, and is not currently available for the TM4C123 platform. This implementation uses a piecewise heuristic: gas resistance in Ω is mapped to an IAQ score that decreases monotonically with cleanliness, with separate handles for sensor warm-up (gas > 1 MΩ → IAQ = 0, sensor still burning in), excellent (≥ 300 kΩ → IAQ = 0), good (50–300 kΩ → linear 0–50), moderate (10–50 kΩ → linear 50–150) and poor (< 10 kΩ → linear 150–500). While this approximation lacks the calibration accuracy of BSEC, it provides a useful relative indicator for trending air-quality changes.
4.2 Lite-On LTR-390UV-01 — Ambient Light and UV Sensor
The LTR-390 contains two independent 20-bit ADC channels: one filtered for human-eye visible wavelengths (ALS mode, peak ~555 nm) and one sensitive to UV-A radiation (UVS mode, 300–400 nm). The sensor is configured with a measurement rate of 100 ms and integration time of 100 ms (MEAS_RATE register = 0x22) and a gain of 1× (GAIN register = 0x01). The firmware performs sequential ALS and UV measurements by toggling the mode bits in MAIN_CTRL (0x02 for ALS, 0x0A for UVS). Data readiness is confirmed by polling bit 3 of the MAIN_STATUS register before reading the three ALSDATA or UVSDATA bytes.
Lux conversion uses the simplified formula lux = ALS_raw / 3, valid at the configured gain and integration time. The UV index is calculated as UVI = UVS_raw / 2300, where 2300 counts/UVI is the nominal sensitivity at gain = 1× and 100 ms integration according to the LTR-390 datasheet. The chip ID register is read at startup and verified to be 0xB2 to confirm correct I2C communication.
V.MAXIMUM INTEGRATED MAX4466 – SOUND LEVEL SENSOR
5.1 Hardware and Driver Stack
The BOOSTXL-K350QVG-S1 is a TI BoosterPack carrying a 3.5-inch 320 × 240 16-bit colour TFT panel based on the SSD2119 controller, a four-wire resistive touch overlay (not used in this revision), and accompanying SD-card and SPI flash sockets. The panel is driven over the LaunchPad’s SSI peripheral; the Kentec320x240x16_ssd2119_spi driver supplied by TI exposes the panel as a tDisplay structure consumable by the TivaWare grlib graphics library. All higher-level drawing strings, rectangles, buffer clears is performed against a tContext bound to that tDisplay.
5.2 Layout and Update Strategy
On startup the firmware draws a static “IoT Env Monitor” cyan title at the top of the screen and a left-aligned column of seven white labels: Temp (°C), Hum (%), Pres (hPa), Light (Lux), UV Index, Noise (dB), and IAQ / Gas. Live values are rendered in yellow in a right-aligned column. To avoid full-screen flicker, every update cycle clears only the values column (a vertical strip from x = 180 to x = 319) by drawing a black filled rectangle, and then redraws the seven values; the static labels and title are never touched after init. This partial-clear strategy keeps screen refresh below ~30 ms per cycle and avoids the visible “black flash” common in naive full-clear implementations.
The MAX4466 is an adjustable-gain microphone amplifier (200× nominal on these breakout boards) with a 20 Hz–20 kHz bandwidth and an output centred at half-supply (≈1.65 V on a 3.3 V rail). The TM4C123’s ADC samples this signal on PE3 (AIN0) at 12-bit resolution (0–4095 counts). Because the MAX4466 output is AC-coupled audio, the firmware uses a peak-to-peak amplitude measurement rather than a true RMS calculation.
Three bursts of 64 samples each are collected at approximately 4 ms intervals. Within each burst, the minimum and maximum ADC values are tracked; the burst’s peak-to-peak amplitude is their difference. The median of the three burst results is taken to suppress transient sounds that would skew a single measurement. This median value is passed through a 13-step threshold lookup table that maps ADC peak-to-peak counts to approximate dB SPL values (25 dB up to 85 dB), calibrated empirically against a reference sound-level meter app.
VI.LOCAL DISPLAY SUBSYSTEM-BOOSTXL – K350QVG-S1
This paper detailed the successful development of a highly optimized, interactive fractal generator on an Artix-7 FPGA. By abandoning sequential calculation in favor of a deep pipelined architecture, and implementing a FIFO-driven quad-core load balancing system, the design achieves exceptional computational throughput. The choice of Q4.20 fixed-point arithmetic proved optimal for maximizing zoom depth while adhering to hardware resource constraints, and the system maintained robust timing closure across all scaling configurations. Future work could involve interfacing the computational cluster with an external DDR3/DRAM frame buffer via the AXI4 protocol. This would decouple the compute frequency from the strict 25 MHz VGA pixel clock, allowing the quad-core engine to run at its maximum theoretical frequency (>100 MHz based on current timing slack) and process frames faster than the display refresh rate.
6.1 Hardware and Driver Stack
The BOOSTXL-K350QVG-S1 is a TI BoosterPack carrying a 3.5-inch 320 × 240 16-bit colour TFT panel based on the SSD2119 controller, a four-wire resistive touch overlay (not used in this revision), and accompanying SD-card and SPI flash sockets. The panel is driven over the LaunchPad’s SSI peripheral; the Kentec320x240x16_ssd2119_spi driver supplied by TI exposes the panel as a tDisplay structure consumable by the TivaWare grlib graphics library. All higher-level drawing — strings, rectangles, buffer clears — is performed against a tContext bound to that tDisplay.
6.2 Layout and Update Strategy
On startup the firmware draws a static “IoT Env Monitor” cyan title at the top of the screen and a left-aligned column of seven white labels: Temp (°C), Hum (%), Pres (hPa), Light (Lux), UV Index, Noise (dB), and IAQ / Gas. Live values are rendered in yellow in a right-aligned column. To avoid full-screen flicker, every update cycle clears only the values column (a vertical strip from x = 180 to x = 319) by drawing a black filled rectangle, and then redraws the seven values; the static labels and title are never touched after init. This partial-clear strategy keeps screen refresh below ~30 ms per cycle and avoids the visible “black flash” common in naive full-clear implementations.
6.3 Initialisation Order Caveat
Because the SSD2119 driver and the I2C0 module both touch GPIO Port B, the firmware initialises the TFT BoosterPack first and the I2C peripheral immediately after. Reversing this order causes the I2C pinmux on PB2/PB3 to be silently overwritten by the display driver’s GPIO setup and yields a non-responsive bus a failure mode encountered during early bring-up and resolved by the documented ordering.
VII.FIRMWARE DESIGN
7.1 Peripheral Initialisation Sequence
The firmware initialises peripherals in a strict order that satisfies hardware dependencies: (1) system clock is configured to 80 MHz using the main 16 MHz crystal with PLL enabled (SYSCTL_SYSDIV_5); (2) UART0 console is brought up first so any subsequent init failures can be reported; (3) UART1 to the ESP8266 is configured at 115 200 baud, 8N1; (4) the BOOSTXL-K350QVG-S1 TFT and grlib graphics context are initialised; (5) I2C0 is configured at 100 kbps after the display, to protect the PB2/PB3 pinmux; (6) BME680, LTR-390, and MAX4466 are initialised in sequence with UARTprintf confirmation messages after each.
7.2 Bosch BME68x API Integration
The Bosch BME68x API (bme68x.h / bme68x.c) abstracts all register-level communication behind read and write function pointers stored in a struct bme68x_dev instance. The firmware provides bme68x_i2c_read() and bme68x_i2c_write() bridge functions that wrap the local i2c_read_regs() and i2c_write_reg() helpers built directly on the TivaWare driverlib I2C master. The delay function pointer is mapped to SysCtlDelay() with appropriate scaling (period_us × SysCtlClockGet() / 3 000 000).
7.3 UART Packet Protocol (TM4C123 → ESP8266)
The TM4C123 transmits a fixed-format, comma-delimited ASCII packet terminated by a newline character (‘\n’) after each measurement cycle. The packet format is: temp, hum, pres, iaq, als, uvi, sound,gas_ kohm\n All fields are signed or unsigned decimal integers. Gas resistance is pre-divided by 1000 to convert from Ohms to kΩ before transmission, reducing string length. The ESP8266 Arduino sketch parses this packet by splitting on commas and assigning each token to the corresponding Blynk virtual pin (V0 through V7) via Blynk. virtualWrite().
VIII.COULD INTEGRATION – BLYNK IoT PLATFORM
8.1 Blynk Virtual Pin Mapping
The Blynk platform assigns one virtual pin per sensor channel. The ESP8266 sketch listens for the serial packet from the TM4C123, parses it, and calls Blynk.virtualWrite() for each of the eight channels. The mapping is summarised below.
8.2 Blynk Dashboard Layout
The Blynk web console dashboard is configured with eight widgets arranged in a grid (see Figure 3). Semicircular gauges are used for Temperature, Humidity, IAQ Index, UV Index and Sound Level; numeric value tiles are used for Pressure and Gas Resistance; and a SuperChart provides historical trending of Ambient Light. The mobile application (see Figure 2) replicates this layout in a phone-friendly stacked configuration, providing all eight primary telemetry channels at a glance. Both dashboards confirm active data reception and animate on every 2-second update cycle.
IX.RESULTS AND OBSERVATIONS
9.1 Local TFT vs Cloud Latency
The local BoosterPack TFT updates within ~30 ms of each completed measurement cycle, providing effectively instantaneous on-node feedback. The end-to-end latency from sensor reading completion to value appearing on the Blynk web console was observed to be approximately 1–2 seconds, dominated by the loop cadence and Wi-Fi round-trip time. The UART transmission from TM4C123 to ESP8266 is negligible (< 5 ms for an 80-byte packet at 115 200 baud). The system maintained stable uptime for the duration of testing with no dropped Wi-Fi connections observed.
9.2 MAX4466 Sound Level Accuracy
The peak-to-peak dB estimation method provides categorical rather than metrologically accurate sound-level measurements. The 13-step lookup table produces output in 5 dB steps, which is sufficient for environmental classification (quiet / normal / loud) but not for regulatory noise monitoring. At ambient lab conditions the sensor consistently reported 40–45 dB, which correlates with measured values from a reference smartphone SPL app (43–47 dB), confirming the lookup-table calibration is broadly correct in the 40–50 dB range. Clapping near the sensor produced 65 dB readings, consistent with expected response.
9.3 LTR-390 UV and Light Performance
Indoors under fluorescent/LED lighting, UV index readings were consistently 0 UVI, as expected since artificial light sources produce negligible UV-A radiation. When the sensor was briefly exposed to direct sunlight through a glass window, UV index readings rose to 1–2 UVI, consistent with attenuation by glass. Ambient light readings around 100–300 lux at the workbench are consistent with typical office illumination. The LTR-390’s chip ID (0xB2) was confirmed at initialisation, verifying correct I2C communication.
9.4 Power Subsystem Verification
The LM2596 buck regulator was verified to produce a stable 5.0 V output (measured 4.98–5.02 V on the on-board voltmeter) when fed from each of the three target sources: a 5 V / 2 A USB power bank (input ≈ 5.0 V), a generic 9 V / 1 A wall adapter via barrel jack (input ≈ 9.0 V), and a bench supply set at 12 V / current limit 1 A (input = 12.0 V). System behaviour was indistinguishable across all three sources, confirming that the wide-input buck front-end successfully decouples the deployment scenario from the rest of the design.
X.DISCUSSION
10.1 Limitations and Future Work
Several limitations of the current implementation are noted. First, the IAQ index is a heuristic approximation and should be replaced with the Bosch BSEC algorithm running on a more capable processor (ESP32 or Raspberry Pi) for production deployments. Second, the BME680 self-heating artefact in forced mode introduces a systematic temperature offset; this can be mitigated by mounting the sensor away from heat sources and applying a calibration offset, or by switching to lower-power sequential mode with longer standby periods. Third, the MAX4466 peak-to-peak method is a proxy for sound-pressure level and cannot distinguish frequency content; a proper Leq measurement would require DMA-based continuous sampling and RMS computation.
Planned future enhancements include: (1) replacing the integer IAQ heuristic with full BSEC integration; (2) adding a PM2.5 particulate-matter sensor (e.g. PMS5003) for air-quality completeness; (3) using the BoosterPack’s resistive touch overlay for on-screen calibration and threshold setting; (4) implementing UART RX parsing on the TM4C123 to receive Blynk-initiated commands (LED actuator control, threshold alerts); and (5) adding non-volatile data logging to an SD card with RTC timestamping for offline analysis.
10.2 Power Considerations and Portability
The wide-input LM2596 front-end gives the design a portability that is unusual for student-grade IoT prototypes: the same hardware that runs from a 12 V bench supply during bring-up runs unchanged from a 5 V power bank for field demonstrations. The BME680 (≈0.9 mA peak), LTR-390 (≈0.4 mA), and MAX4466 (≈0.5 mA) are negligible loads. The ESP8266 is the dominant consumer, drawing 70–200 mA during Wi-Fi transmission bursts; the BoosterPack backlight adds roughly 50–80 mA. For battery-powered deployment, the measurement cadence should be increased to 60 s, the ESP8266 should be placed in modem-sleep between transmissions, the BoosterPack backlight should be PWM-dimmed or gated by an inactivity timer, and the BME680 heater duration should be reduced. Under these conditions, a 2 000 mAh USB power bank could plausibly sustain over 24 hours of operation.
XI.CONCLUSION
A fully functional IoT-based Multi-Parameter Environmental Monitoring System was successfully designed, implemented, and validated on the TI TM4C123GXL ARM Cortex-M4 microcontroller. The system simultaneously acquires seven environmental parameters from three heterogeneous sensors Bosch BME680 (temperature, humidity, pressure, gas/IAQ), Lite-On LTR-390 (ambient light, UV index), and Maxim MAX4466 (sound level) processes them on the TM4C123, presents them locally on the BOOSTXL-K350QVG-S1 320 × 240 colour TFT BoosterPack, and streams all eight channels to the Blynk IoT cloud platform via an ESP8266 co-processor. A wide-input LM2596 buck DC-DC front-end allows the node to be powered interchangeably from a USB power bank, a phone charger, or a bench laboratory supply without any wiring changes. The system has been verified in live operation, with the on-board TFT, the Blynk web console, and the Blynk mobile application all confirming real-time reception of the sensor channels. The project demonstrates a complete IoT data-acquisition pipeline sensor selection, mixed-bus integration, firmware partitioning, local visualisation, protocol design, and cloud telemetry and provides a modular firmware architecture that supports straightforward extension to additional sensors and actuator feedback channels.
REFERENCES
[1] Texas Instruments, “Tiva C Series TM4C123GH6PM Microcontroller Data Sheet,” SPMS376E, 2014.
[2] Texas Instruments, “BOOSTXL-K350QVG-S1 BoosterPack User’s Guide and Kentec QVGA Display Driver Reference,” Tools Folder, 2015.
[3] Texas Instruments, “TivaWare Peripheral Driver Library User’s Guide,” SPMU298D, 2020.
[4] Texas Instruments, “TivaWare Graphics Library (grlib) User’s Guide,” SPMU300, 2020.
[5] Bosch Sensortec, “BME680 Data Sheet — Digital Humidity, Pressure, Temperature & Gas Sensor,” BST-BME680-DS001-00, 2017.
[6] Bosch Sensortec, “BME68x Sensor API,” GitHub repository: BoschSensortec/BME68x-Sensor-API, accessed 2025.
[7] Lite-On Technology Corporation, “LTR-390UV-01 Ambient Light and UV Sensor Data Sheet,” DS-LTR-390UV-01, Rev 1.0, 2018.
[8] Maxim Integrated, “MAX4465–MAX4469 Microphone Preamplifiers with Variable Gain Data Sheet,” Rev 2, 2006.
[9] Texas Instruments, “LM2596 SIMPLE SWITCHER Power Converter 150 kHz 3 A Step-Down Voltage Regulator,” SNVS124E, 2016.
[10] Blynk Inc., “Blynk IoT Platform Documentation,” https://docs.blynk.io, accessed 2025.
[11] Espressif Systems, “ESP8266EX Datasheet,” Version 6.6, 2020.
Recent Comments