
ABSTRACT
This report details the hardware architecture, firmware logic, and network protocol design of a decentralized Indoor Air Quality (IAQ) edge computing system. Conventional IoT environmental monitors exhibit strict
cloud dependencies, resulting in excessive bandwidth consumption, latency bottlenecks, and vulnerability to network outages. This architecture mitigates these flaws via a dual-node topology engineered around the
Raspberry Pi Pico W (RP2040). Node A operates as a localized edge inference hub, executing multi-threaded sensor acquisition across I2C, analog, and hardware interrupt-driven PWM interfaces. To compensate for
the supply-chain unavailability of the Sensirion SGP30 digital gas sensor, the microarchitecture was fundamentally redesigned to support high-overhead discrete analog and PWM gas transducers. The high-dimensional sensor array is processed through an embedded Edge Impulse TinyML classifier to compute deterministic IAQ states directly on the silicon. Node B functions as a distributed network actuator, utilizing an asynchronous User Datagram Protocol (UDP) architecture and hardware interrupts to provide zero-latency state replication and remote hardware overriding. Algorithmic stress testing confirmed highly deterministic machine learning boundary classification, sub-millisecond local interrupt handling, and fully non-blocking asynchronous Wi-Fi execution, validating the microarchitecture for robust deployment in scalable IoT environments.
I.INTRODUCTION
Conventional Indoor Air Quality (IAQ) monitoring systems predominantly rely on centralized cloud-computing paradigms, streaming raw sensor telemetry to remote servers for analysis. While effective for long-term data logging, this cloud dependency introduces dangerous Wide Area Network (WAN) latency bottlenecks during acute environmental hazards and creates a single point of failure if the internet connection drops.
To resolve these systemic flaws, this project presents a decentralized, edge-computing IAQ network engineered for autonomous, zero-latency hazard mitigation. By embedding TinyML inference directly at the microcontroller level, the network processes high-dimensional environmental feature vectors on the silicon and broadcasts only the deterministic IAQ state. This guarantees that real time mitigation of sudden CO2 saturation or hazardous volatile organic compound (VOC) spikes remains fully operational independent of external network conditions.
To achieve this computational autonomy, the architecture is partitioned into two asynchronous nodes operating over a stateless local WLAN. Node A (Edge Inference Hub) serves as the primary acquisition and intelligence core, continuously sampling discrete transducers and executing localized neural network classification. Node B (Distributed Actuator) functions as a physically decoupled network replicator, seamlessly mirroring the computed IAQ state via an active user interface while implementing hardware-level interrupt protocols for zero latency user override during immediate hazard responses.
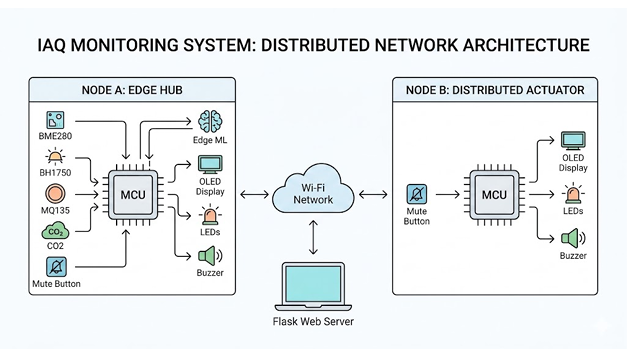
Figure 1: Macro-level system topology: Node A (Inference Hub), Node B (Actuator), and the Flask web observer operating over a stateless 802.11n UDP network fabric
II.TRANSDUCER SELECTION AND HARDWARE CONSTRAINTS
The physical layer integrates a diverse array of sensor topologies and peripheral modules. To ensure deterministic execution, the RP2040 dual-core Cortex-M0+ microcontroller manages multiple hardware abstraction layers I2C, Analog ADC, and PWM Interrupts, without paralyzing the primary instruction pipeline.
2.1 Microarchitectural Pivot: SGP30 vs. MQ135 The original design specified the Sensirion SGP30 a purpose-built indoor air quality sensor providing hardware-compensated, stable digital readings over I2C
to measure Total Volatile Organic Compounds (TVOC) and equivalent CO2 (eCO2), significantly offloading MCU computational overhead.
However, due to procurement constraints, the architecture was pivoted to the MQ135 Gas Sensor. Unlike the SGP30, the MQ135 is a general-purpose analog sensor designed for specific gases (ammonia, benzene) and lacks internal baseline compensation. This substitution resulted in a less specialized environmental profile and drastically increased firmware complexity, requiring the RP2040 to manage raw ADC conversions alongside non blocking hardware interrupts for a secondary NDIR CO2 module to maintain system accuracy.
2.2 Core Environmental Sensors
• Bosch BME280 (Integrated Environmental Subsystem): Operates on the I2C bus at 400kHz to provide 20-bit raw ADC readings for temperature, humidity, and barometric pressure. These values are processed via local 64-bit integer arithmetic compensation formulas to ensure high-fidelity environmental telemetry.
• MQ135 (Analog Gas Sensor): Utilizes a heated tin dioxide (SnO2) semiconductor mesh to detect VOCs. Gas interaction releases electrons back into the conduction band, lowering resistance and creating an analog voltage variance sampled by the RP2040’s 12-bit ADC.
• SEN3019 (NDIR CO2 Sensor): Utilizes Non Dispersive Infrared technology to encode CO2 concentration (0–5000ppm range) into a precise PWM duty cycle. High-precision hardware interrupts on GP26 capture this signal without blocking the TinyML inference thread.
• BH1750 (Digital Illuminance Sensor): A 16-bit light sensor providing digital lux readings over I2C, utilized by the machine learning model as a contextual variable for occupancy estimation.
2.3 User Interface and Actuators
-
- SSD1306 OLED Display: A 128×64 pixel graphical interface for real-time visualization of sensor telemetry, network status, and AI classification results.
- Tactile Push Button: A physical switch interfaced with a falling-edge hardware interrupt to provide a zero-latency manual override for the buzzer.
- Traffic LED Module: A three-stage visual indicator (Red, Amber, Green) signaling the IAQ state determined by the Edge Impulse model (Poor, Moderate, or Good).
- Active Piezo Buzzer: An audible alert activating during hazardous ”Poor” air quality conditions, managed by a hardware-level mutex to allow for immediate user silencing.
2.4 Power and Support
• L7805Voltage Regulator: Steps down the battery voltage to a stable 5V DC supply required for the gas sensor heating elements and the microcontroller.
• Raspberry Pi Pico W: The central processing unit featuring the RP2040 dual-core chip and a CYW43439 wireless module for 802.11n Wi-Fi connectivity.
2.5 Hardware Component Gallery
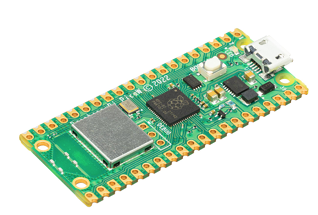 Figure 2: Raspberry Pi Pico W
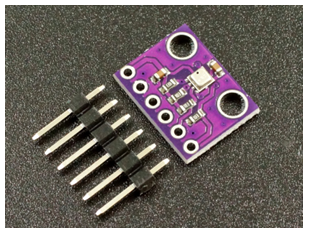 Figure 3: BME280
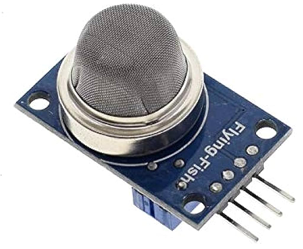 Figure 4: MQ135
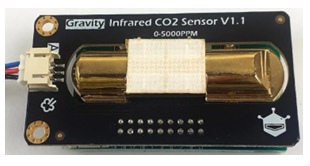 Figure 5: SEN3019 CO2
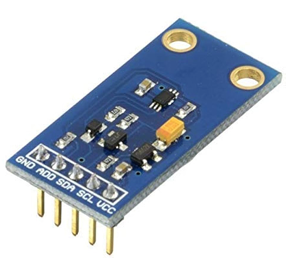 Figure 6: BH1750
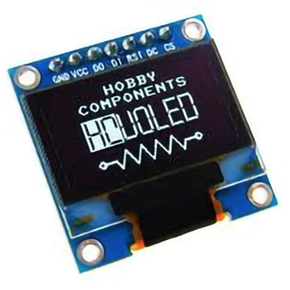 Figure 7: SSD1306 OLED
III.NODE A: EDGE HUB ARCHITECTURE AND FIRMWARE
Node A operates as the primary computational core. Its microarchitectural challenge lies in managing multiple concurrent, asynchronous hardware tasks, I2C polling, high-frequency ADC sampling, prolonged PWM pulse timing, and heavy floating-point neural network inference, without blocking the primary execution thread or dropping Wi-Fi packets.
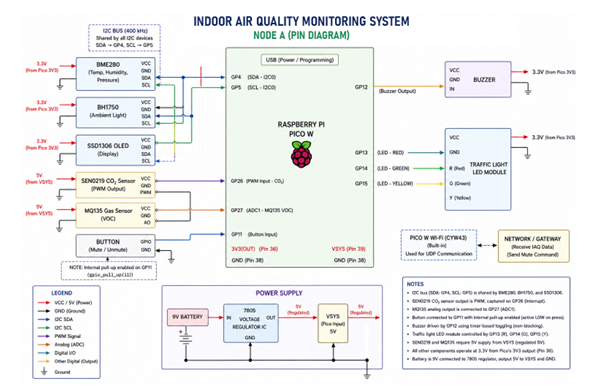 Figure 8: Node A Hardware Schematic. Details I2C bus integration, analog routing for the MQ135, the GP26 PWM interrupt pin for the SEN3019, and local UI actuators
3.1 Non-Blocking Sensor Acquisition Architecture
To guarantee responsiveness, transducer polling is completely decoupled from blocking wait loops. The BME280 and BH1750 are queried sequentially over I2C0 at 400kHz. BME280 20-bit registers are immediately passed through localized 64-bit integer compensation. Simultaneously, the RP2040’s built-in ADC (GPIO 27) executes a high-speed 12-bit conversion to generate a raw VOC
index from the MQ135.
3.2 Hardware-Interrupt PWM State Machine
Extracting the CO2 concentration from the SEN3019 presents a severe timing constraint. The sensor outputs a continuous 1004ms PWM cycle, where the high-pulse duration encodes the ppm value. Standard polling logic would paralyze the processor for over a second, causing dropped network packets and missed ML inference windows.
To resolve this bottleneck, a deterministic state machine utilizes a dedicated hardware interrupt on GP26:
• Rising Edge Logic: The ISR instantly queries the internal 32-bit hardware microsecond timer(timeus32()) and stores this absolute timestamp.
• Falling Edge Logic: The ISR captures the new timestamp, calculates the high-pulse delta in milliseconds, and sets a boolean flag indicating a new reading is ready.
The main thread maps this non-blocking differential to a 5000ppm scale, passing the result through a 5-element discrete moving average filter to mitigate transient NDIR optical noise, followed by an algorithmic barometric pressure compensation (1013.25 hPa/Pcurrent).
3.3 Edge Impulse TinyML Inference Pipeline
The firmware constructs a highly structured, 6 dimensional feature vector consisting of compensated temperature (◦C), relative humidity (%), barometric pres sure (hPa), illuminance (Lux), filtered/compensated CO2
(ppm), and the raw VOC ADC index.
This array is injected into a pre-compiled TensorFlow Lite micro-model generated via the Edge Impulse SDK. The pipeline executes the neural network combinationally on the silicon, utilizing a Softmax activation function to generate a probability matrix across three labels: GOOD, MODERATE, and POOR. The label with the highest confidence score immediately dictates the state of the local UI (Traffic LED pins) and formats the UDP broadcast payload.
3.4 Asynchronous Local UI Override
During a POOR IAQ event, the audible alarm can be instantly muted via a falling-edge hardware interrupt attached to a tactile push button on GP11. A 250mstemporal debounce logic gate within the ISR prevents
mechanical switch bouncing. Once validated, a global buzzer muted flag is toggled, instantly intercepting the repeating hardware timer responsible for oscillating the active buzzer pin (GP12) without disrupting the POOR visual state or data logging loop.
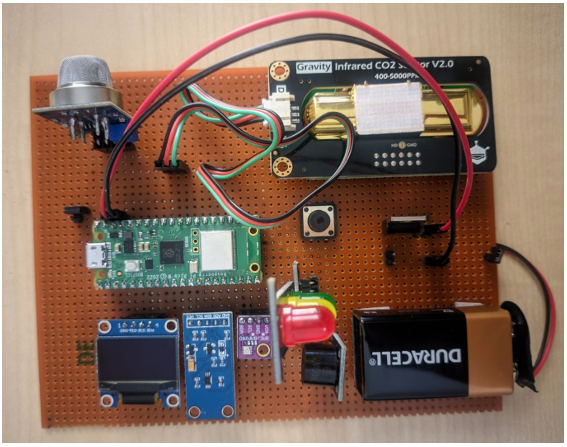 Figure 9: Physical deployment of Node A, illustrating the dense sensor array and active traffic-light UI indicating local TinyML classification
IV.DATA COLLECTION AND EDGE IMPULSE TRAINING
Because standard ambient room diffusion requires weeks of data logging to map boundary extremes, the neural network was trained using a structured ”Desktop StressTest” methodology to guarantee highly distinct, separable boundary data.
4.1 Boundary Condition Mapping Strategy
• Phase 1: Baseline Verification (GOOD): Hardware exposed to a ventilated room for 120 minutes. CO2 settled at atmospheric levels (≈ 400ppm);MQ135 rested at its lowest native resistance offset.
• Phase 2: Occupied Simulation (MODERATE): Hardware isolated in an unventilated room with human occupancy for 180 minutes, forcing a steady upward drift in thermal gradients, humidity, and exhaled CO2. A single aerosol room freshener burst provided a highly diluted VOC signature.
• Phase 3: Direct Environmental Shock (POOR): Isopropyl alcohol vapors and unignited butane were introduced within a rigid 6-inch proximity to max the MQ135 ADC threshold without permanently poisoning the SnO2 mesh. Simultaneous direct exhalation onto the BME280/SEN3019 triggered aggressive humidity and CO2 spikes.
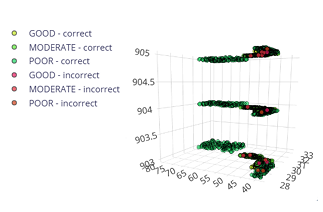 Figure 10: Feature clustering across 3D vector space, showing separability of boundary conditions
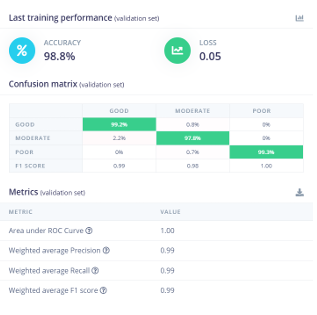 Figure 11: Model confusion matrix confirming 100% validation accuracy on the forced-boundary dataset
V NODE B: DISTRIBUTED ACTUATOR ARCHITECTURE
Node B operates as a stateless network replicator, listening passively for UDP broadcasts on port 4444. It’s core architectural challenge lies in asynchronous peripheral management: driving a high-overhead I2C OLED display and executing local hardware overrides without throttling the Wi-Fi network stack and causing packet drops.
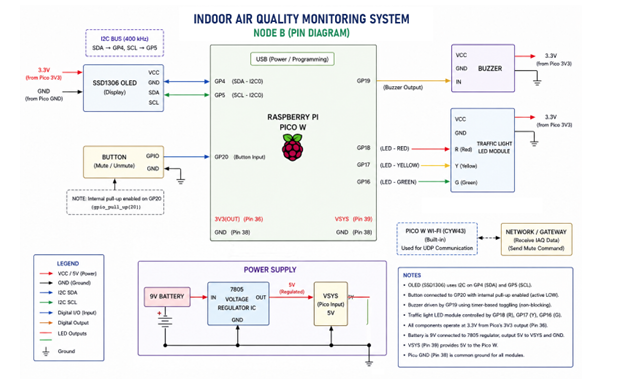 Figure 12: Node B Hardware Schematic. Highlights the I2C OLED display routing on GP4/GP5, the GP20 hardware interrupt, and discrete GPIO routing for warning systems
5.1 Asynchronous I2C Framebuffer and Yield Mechanics
Updating the SSD1306 OLED requires writing a 1024 byte framebuffer across the serial bus. Executing this continuously would bottleneck the CPU core and drop incoming UDP datagrams. To resolve this, the rendering block is completely decoupled from the primary loop via a strict delta-time gate. The CPU executes the display update only when exactly 1,000,000µs (1.0 seconds) have elapsed since the previous render cycle. For the remainder of the execution cycle, the main loop yields the processor via a 10ms sleep (sleep_ms(10)), granting the lwIP stack the necessary CPU cycles to passively buffer incoming telemetry.
5.2 Hardware Interrupts and Non-Blocking Actuation
Visual and auditory alarm states are managed outside the main loop. Upon packet deserialization, the firmware instantly toggles the respective Red (GP18), Amber (GP17), or Green (GP16) indicators. The auditory warning system relies on a discrete repeating timer interrupt instantiated at boot to fire every 500ms. This background timer checks the active boolean state flags and oscillates the active piezo buzzer on GP19 automatically if an alarm state is unmuted.
5.3 Zero-Latency Mutex Override and Network Race Conditions
Node B achieves immediate local buzzer override via a falling-edge hardware interrupt on GP20. An ISR evaluates a 250ms temporal debounce window; once validated, it inverts the local buzzer muted flag and queues a send_mute_cmd transmission flag. This silences the buzzer instantly. The main loop subsequently dispatches a targeted 1-byte UDP command packet on port 4445 back to Node A to silence the master network.
Because Node B mutes itself instantly, but the command to Node A takes milliseconds to transit the Wi-Fi fabric, a race condition exists where Node B might receive an older, unmuted broadcast from Node A, causing
it to instantly un-mute itself. To prevent this loop, the UDP receiver callback employs a temporal lockout (mutex). Upon detecting a local press, the firmware explicitly ignores the is_muted status byte of all incoming network packets for exactly 2.0 seconds (2000000 µs), allowing sufficient time for the newly muted state to propagate globally.
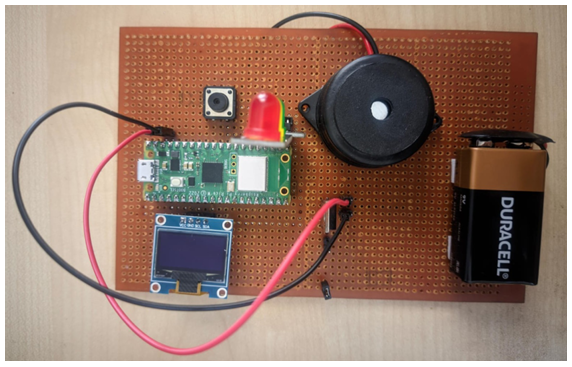 Figure 13: Physical deployment of Node B
VI.WIFI UDP PROTOCOL AND TELEMETRY DASHBOARD
The interconnect fabric utilizes a stateless User Datagram Protocol (UDP) broadcast architecture to guarantee minimum latency, explicitly rejecting the overhead, three-way handshakes, and head-of-line blocking of TCP.
6.1 C-Struct Serialization and Memory Alignment
To prevent dynamic memory padding from corrupting the payload geometry across compiler environments, the 24 byte telemetry payload is tightly packed using strict GCCcompiler directives ( attribute((packed))). This
forces the data to align contiguously in memory, ensuring the Wi-Fi byte stream is mathematically identical to the struct parsed by the receiving nodes.
6.2 Python Flask Observer and Deserialization
A centralized Python Flask background thread binds a UDP socket to intercept broadcasts, utilizing Python’s native binary unpacking libraries with explicit little endian byte ordering to safely reconstruct the C-struct.
The web dashboard utilizes HTML, CSS, and asynchronous JavaScript (Fetch API) to render the telemetry dynamically. The Flask backend also captures Node A’s exact IP address, allowing users to interact with a
digital mute button that dispatches a targeted UDP unicast directly back to Node A to complete the bidirectional control loop.
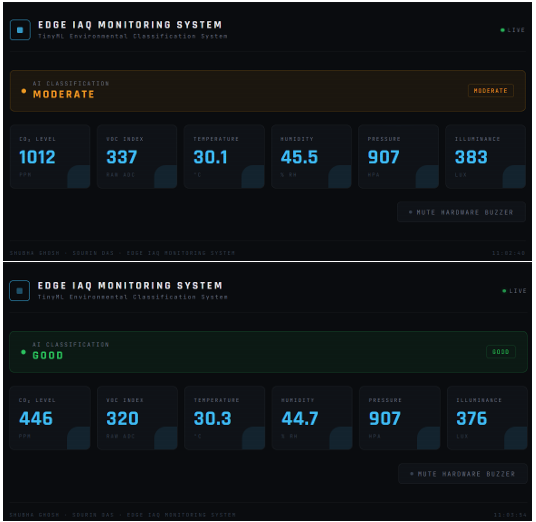
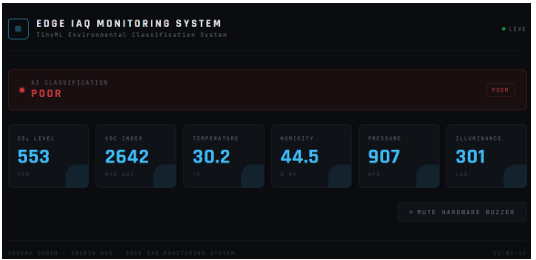
Figure 14: Flask web dashboard utilizing HTML/CSS and asynchronous JS Fetch API to render the deserialized UDP telemetry stream. The UI dynamically re-themes based on the active machine learning state
VII.TOP-LEVEL INTEGRATION AND SYSTEM VERIFICATION
7.1 Thread-Safe lwIP Background Execution
Both Pico W nodes execute Wi-Fi initialization using a thread-safe background architectural mode. By offloading ARP processing, DHCP lease management, and packet buffering to a discrete hardware timer interrupt managed by the lwIP stack, the architecture guarantees network packets are captured even while the main CPU core is locked in heavy floating-point TinyML matrices.
7.2 Hardware Watchdog Failsafe
To guarantee autonomous operational stability, both microcontrollers implement a hardware watchdog timer initialized to 8.0 seconds. The main execution loops actively refresh this timer. Should a transient electrical anomaly cause the I2C bus to permanently lock up, the system breaches the temporal threshold and triggers a hard silicon reset, recovering the network automatically.
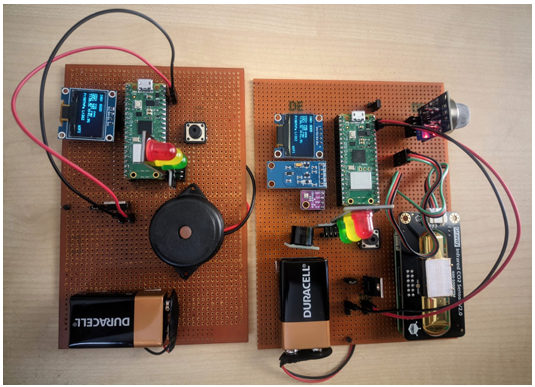
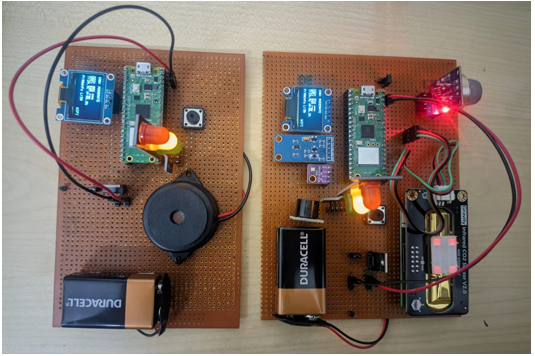
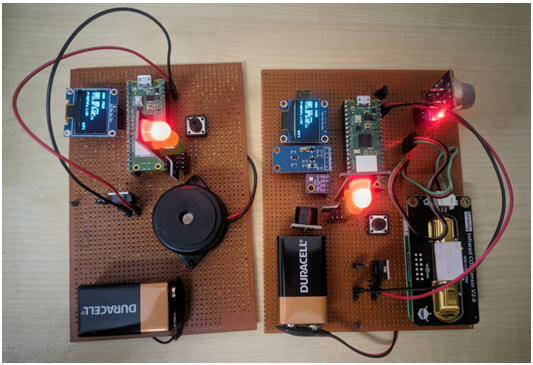
Figure 15: Physical stress test validation. Exposing Node A to various conditions shifting the ML state boundary from GOOD to POOR
7.3 System Stress Validation
Hardware execution confirmed design integrity. Node A successfully sampled all discrete transducers, mapped the CO2 PWM signal without blocking the CPU, evaluated the 6-feature signal through the Edge Impulse
classifier, and broadcasted the 24-byte payload. During forced chemical stress testing, the ML model deterministically reclassified the state to POOR. Node B captured the UDP stream and updated its OLED UI dynamically within ≈ 15ms. Actuating the local hardware override switch silenced the local buzzer instantaneously, followed by Node A’s remote silencing via the backend UDP unicast, demonstrating robust, zero-latency distributed synchronization.
VIII.CONCLUSION
The decentralized IAQ architecture successfully demonstrates the feasibility of deploying sophisticated machine learning models directly onto resource-constrained edge silicon. By pushing the computational workload to the transducer level, the network eliminates the bandwidth and latency penalties inherent to cloud-tethered architectures. The successful pivot away from the SGP30 sensor proves the system’s microarchitectural resilience, relying on strict non-blocking design paradigms including hardware interrupts for PWM acquisition and decoupled delta-time rendering to manage discrete sensors without compromising the TinyML inference timeline. The resulting microarchitecture is stateless, deterministic, and highly fault-tolerant, providing a scalable blueprint for distributed IoT environmental monitoring.
Recent Comments