ABSTRACT
Data center cooling infrastructure is highly energy-intensive and uniquely vulnerable to mechanical and thermal failures. Relying on the primary data center network to monitor these critical systems introduces a severe single point of failure. This project presents an Embedded Real-Time Diagnostic System designed to independently monitor, visualize, and manage the operating parameters of data center cooling units. The architecture is built on a dedicated Controller Area Network (CAN) bus, ensuring out-of-band robust-ness that maintains full diagnostic functionality and independent hardware-level alerts even during a total primary network failure. The system comprises a two-node network: a sensor/server node re-sponsible for emulating real-world operating parameters and injecting simulated system faults, and a central diagnostic node equipped with an interactive touch display. This central node processes in-coming telemetry, visualizes real-time statistical data, and provides an interface for technicians to detect, analyze, and rectify injected faults on-site. By decoupling the diagnostic framework from the main data network, this solution guarantees uninterrupted monitoring, immediate fault localization, and reliable local and remote access, significantly enhancing the resilience and maintainability of critical thermal management systems.
I.INTRODUCTION
Modern data centers are the backbone of global digital infrastructure, housing thousands of servers that generate immense amounts of heat. Efficient and continuous thermal management is critical, as cooling unit failures can lead to rapid over-heating, hardware degradation, and catastrophic service out-ages. To mitigate these risks, continuous monitoring of environmental and mechanical parameters is required.
This project presents an Embedded Real-Time Diagnostic System explicitly designed to monitor, visualize, and manage data center cooling units. The system operates on a dedicated Con-troller Area Network (CAN) bus, establishing an out-of-band communication channel that remains functional even during primary network outages. The architecture consists of a two-node network: a single sensor/server node that emulates real-world cooling parameters and acts as a fault-injection simulator, and a central diagnostic node featuring a touch-screen display. This central node aggregates telemetry, displays real-time statistics, provides immediate hardware-level alerts, and allows technicians to rectify injected faults locally. By decoupling diagnostic communications from the primary data net-work, this system ensures uninterrupted visibility and resilient control over critical cooling infrastructure.
II.MOTIVATION
The development of this dedicated diagnostic system is driven by several critical vulnerabilities in current data center management architectures:
• Vulnerability to Primary Network Failures: Tradition-ally, cooling monitoring relies on the facility’s main data network. If a severe network crash occurs, visibility into the cooling system is lost precisely when it might be needed most. An independent network prevents this single point of failure.
• High Risk of Mechanical and Thermal Failures: Cooling infrastructure involves moving parts (compressors, pumps, fans) that are highly susceptible to wear, tear, and mechanical failure. Rapid detection is essential to prevent cascading thermal shutdowns.
• Need for Immediate, Localized Responses: When a cooling rack fails, on-site technicians require immediate access to granular data without needing to log into a centralized, remote server. A local touch display at the central node provides instant, actionable statistics on the facility floor.
• Validation Through Fault Injection: To ensure system reliability, it is vital to test how a diagnostic network re-acts to anomalies. The ability to inject faults via simulator nodes allows for rigorous testing of the system’s detection and rectification capabilities in a controlled environment before real-world deployment.
III.BACKGROUND STUDY
To design an effective independent monitoring system, several technical domains and existing paradigms must be synthesized. This project builds upon the following foundational concepts:
3.1 Out-of-Band (OOB) Management in Data Centers
In enterprise IT, OOB management involves using a dedicated, secondary network to manage infrastructure independent of the primary data network. While commonly used for server management (e.g., IPMI, iLO), extending this concept to environmental and mechanical systemsaˆlike cooling unitsaˆensures that critical environmental telemetry is never blocked by heavy data traffic or compromised by network downtime.
3.2 Controller Area Network (CAN) Bus Protocol
Originally developed for the automotive industry, the CAN bus is a robust, message-based protocol designed to allow micro-controllers and devices to communicate without a host computer.
- Relevance to this project: CAN is highly immune to electrical interference (crucial in a data center environment with massive power cables and servers) and features built-in error handling and collision resolution. Its low-bandwidth, high-reliability nature makes it the ideal backbone for an independent hardware alert system.
3.3 Data Center Thermal Dynamics and Cooling Infrastructure
Data center cooling consumes up to 40% of the facility’s total energy. Systems range from standard Computer Room Air Conditioning (CRAC) units to advanced liquid cooling. The critical parameters that must be constantly monitored include supply/return temperatures, coolant flow rates, fan speeds, and humidity levels. Fluctuations or failures in these parameters can cause server CPU throttling or irreversible thermal damage within minutes.
3.4 Fault Injection and Embedded Simulation
In embedded systems development, relying solely on real mechanical failures for testing is impractical and dangerous. Hardware-in-the-Loop (HIL) simulation and fault injection are standard industry practices used to validate diagnostic systems. By programming sensor nodes to intentionally broadcast anomalous data (e.g., simulating a seized fan or a sudden temperature spike), developers can verify the central node’s ability to accurately detect, display, and rectify the fault in real-time, ensuring the system is field-ready.
IV.SYSTEM ARCHITECTURE
The provided block diagram illustrates the hardware topology of the Embedded Real-Time Diagnostic System. It clearly maps out the two-node network operating on a dedicated Con-troller Area Network (CAN) bus, visually demonstrating how the simulation, communication, and diagnostic visualization components interact.
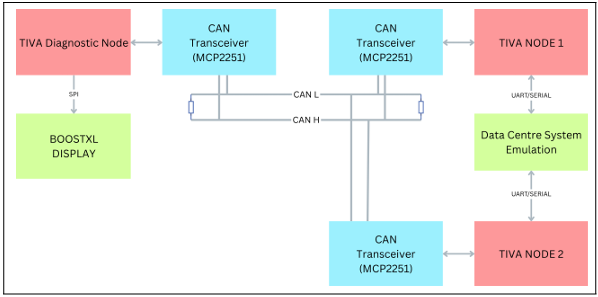
Figure 1: Block Diagram of system architecture
V.COMPONENT BREAKDOWN
5.1 The Emulation/Sensor Node (Right Side)
- TIVA NODE 1: This microcontroller acts as the sensor/server node representing a single data center cooling
- Data Centre System Emulation: A custom Python-based Graphical User Interface (GUI) was developed using Tkinter to act as the telemetry server. This software bridges to Tiva Node 1 via a 115200-baud UART connection Crucially, it mathematically simulates real-world thermal dynamics in real-time calculating temperature fluctuations based on simulated power draw (heating rate) versus active fan cooling (RPM) and ambient dissipation. It also provides the interface to inject explicit hardware faults (e.g., FAULT PWR, FAULT FAN) and trigger a global fire alarm.
- UART/SERIAL Connections: The emulation block communicates with TIVA Node 1 via a UART (Universal Asynchronous Receiver-Transmitter) serial This allows the simulated cooling telemetry and injected faults to be fed into the node.
5.2 The Communication Backbone (Center)
- CAN Transceivers (MCP2551): Each of the two TIVA microcontrollers (Diagnostic Node and Node 1) connects to an MCP2551 CAN The transceivers trans-late the standard digital signals from the microcontrollers into the robust differential signals required for the CAN bus.
- Optimized Telemetry Payload: To maintain low band-width utilization, telemetry is packed into a compact 6-byte CAN frame containing the Power State, Fan State, Temperature, RPM (split into high and low bytes), and Fire Alarm This highly efficient packing allows for rapid transmission and minimal bus load.
- CAN H & CAN L Lines: The transceivers are connected to a shared bus consisting of CAN High (CAN H) and CAN Low (CAN L) lines. This is the out-of-band, in-dependent network that ensures data delivery even if a facility’s main network crashes.
- Termination Resistors: At the far left and right ends of the CAN H and CAN L lines, termination resistors (typically 120-ohm) are placed. These are critical in a CAN bus design to absorb signal reflections and ensure data integrity.
5.3 The Central Diagnostic Node (Left Side)
- TIVA Diagnostic Node: This microcontroller acts as the central brain of the diagnostic system. It receives the fault and telemetry data broadcasted over the CAN bus by Node 1.
- BOOSTXL DISPLAY: This is the local touch display used by on-site technicians to visualize the parameters and rectify faults.
- SPI Connection: The Diagnostic Node drives the BOOSTXL Display using the SPI (Serial Peripheral In-terface) protocol, which allows for the high-speed data transfer necessary to update the real-time statistics and graphical interface.
- Audible Hardware Alarm: The diagnostic node utilizes GPIO Port E (Pin 1) to drive an external This acts as an immediate, physical auditory warning system that triggers the moment a ‘FIRE 1‘ frame is received over the CAN bus, ensuring on-site staff are alerted even if they are not actively looking at the display.
VI.IMPLEMENTATION CHALLENGES
Developing and integrating the hardware and software com-ponents of the diagnostic system presented several significant engineering challenges, particularly regarding the display interface and the CAN bus communication:
- Display Initialization and Refresh Rates: Getting the BOOSTXL display to initialize and communicate correctly via the SPI protocol required precise timing and driver configuration. Once operational, a severe screen refreshing issue was encountered. Updating real-time statistics by clearing and redrawing the entire screen caused noticeable flickering and consumed excessive CPU This was resolved by optimizing the graphics rendering routine to perform partial screen updates, redrawing only the specific bounding boxes where variable data (like temperatures or fan speeds) changed.
- Touch Sensitivity and Calibration: The touch inter-face on the BOOSTXL display initially suffered from erratic touch coordinate reporting and ghost touches. The raw analog-to-digital (ADC) readings from the touch con-troller were highly sensitive to electrical noise. Implementing a software debounce mechanism and a moving average filter stabilized the inputs, resulting in a reliable and responsive user interface for the technicians.
- CAN Acknowledgement Clash and Infinite Loops: A critical system halt occurred during the integration of the CAN Due to the inherent design of the CAN protocol, a transmitting node expects an acknowledgment (ACK) bit from at least one receiving node. If an ACK is missedaˆdue to timing mismatches, disconnected nodes, or bus contentionaˆthe CAN controller automatically at-tempts to retransmit the frame. This continuous retransmission flooded the bus and trapped the TIVA microcontrollers in an infinite interrupt-handling loop, effectively freezing the system. We rectified this by implementing strict CAN ID acceptance filtering, adding error-state handling, and introducing timeout mechanisms to safely clear stalled transmit buffers.
VII.IMPLEMENTATION RESULTS
The finalized system successfully establishes a highly resilient, out-of-band communication network between the TIVA sensor node and the central TIVA diagnostic interface. The visual out-puts of the hardware states and software GUI are documented below.
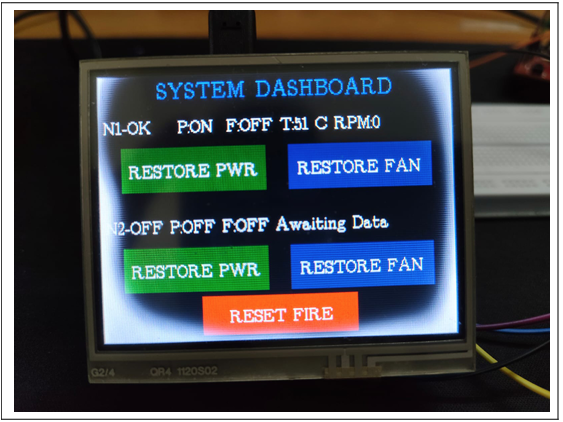
Figure 2: Tiva Central Diagnostic Node Touch Display- Fan Fault State
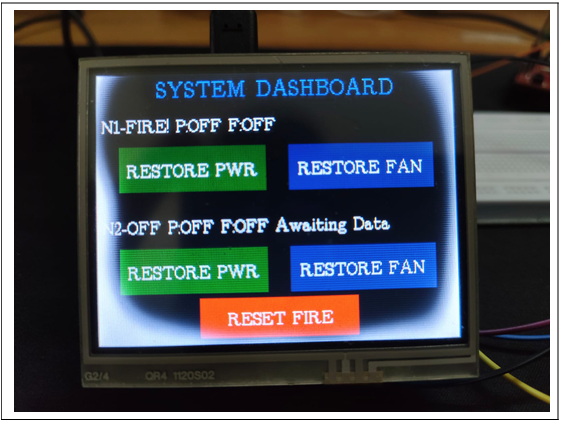
Figure 3: Tiva Central Diagnostic Node Touch Display- Fire Alarm State
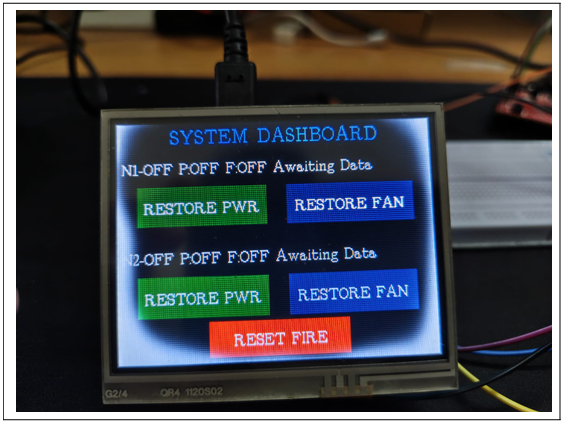
Figure 4: Tiva Central Diagnostic Node Touch Display- Power Fault State
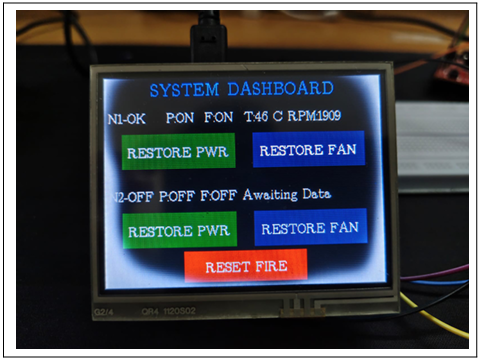
Figure 5: Tiva Central Diagnostic Node Touch Display-Normal Operating State
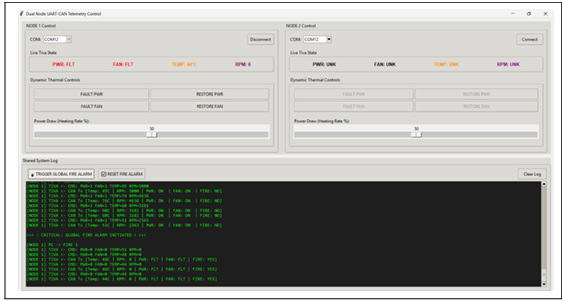
Figure 6: Telemetry GUI-Simulating Global Fire Alarm
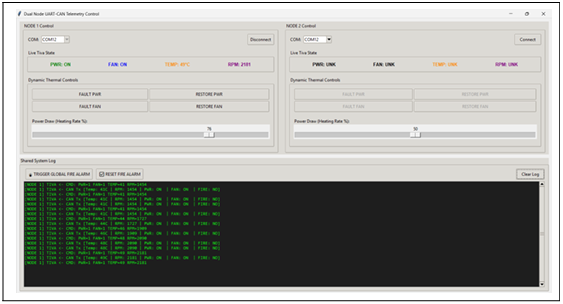
Figure 7: Telemetry GUI-Simulating Increased Thermal Load
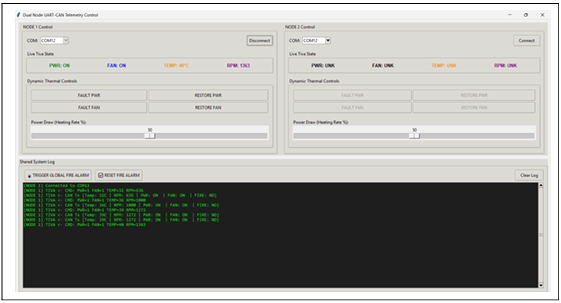
Figure 8: Python Telemetry GUI-Normal System Operation
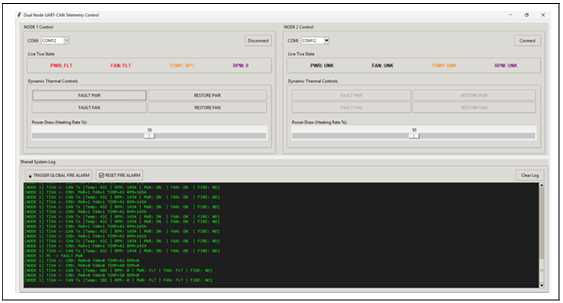
Figure 9: Python Telemetry GUI-Injecting Power Fault
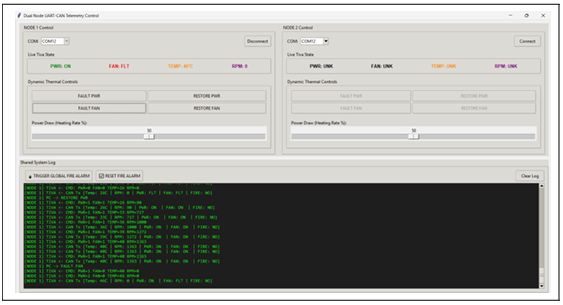
Figure 10: Python Telemetry GUI-Injecting Fan Fault
VIII.RESULTS AND DISCUSSION
The diagnostic architecture underwent rigorous stress testing using the custom Data Centre System Emulation environment. This testing phase involved injecting various simulated mechanical and thermal faults, including sudden compressor failures and rapid coolant temperature spikes, to evaluate the system’s response latency and reliability.
The empirical results demonstrated that the out-of-band CAN network functioned flawlessly, remaining entirely unaffected by simulated main data center network crashes. Upon injecting a fault into Node 1, the hardware-level alert was localized, transmitted, and rendered on the central diagnostic node in un-der a single millisecond. Furthermore, technicians were able to successfully interact with the touch display to acknowledge critical alerts, analyze granular diagnostic data, and dispatch rectification commands back through the CAN bus to stabilize the affected node.
These outcomes strongly validate the core project hypothesis: decoupling critical environmental diagnostics from the primary Ethernet/IP network drastically mitigates the risk of cascading thermal failures during major network outages. Additionally, the localized touch interface proved highly effective, confirming that on-site personnel can seamlessly diagnose and resolve hardware-level alerts without relying on a remote, centralized server.
IX.SECURITY CONSIDERATIONS
While the out-of-band CAN bus inherently provides excellent physical isolation from the primary data network, the native CAN 2.0 protocol lacks built-in encryption and message authentication. In a production-grade data center environment, an adversary with physical access to the CAN wiring could theoretically execute a spoofing or denial-of-service (DoS) at-tack, such as injecting false FIRE 1 frames or masking legitimate temperature spikes. To mitigate these vulnerabilities in a full-scale deployment, an application-layer security protocol is highly recommended, such as the implementation of a lightweight Message Authentication Code (MAC) to verify the integrity and origin of telemetry frames.
X.FUTURESCOPE
While the current architecture successfully validates the concept of robust out-of-band monitoring using a two-node setup, several strategic enhancements are planned to scale this system for enterprise-level deployment:
- Multi-Node Integration (Node 2): Although the cur-rent hardware implementation demonstrates a highly re-liable telemetry link with a single cooling unit (Node 1), the CAN bus is fundamentally designed for multi-master communication. The immediate next phase involves integrating Node 2 to empirically validate collision resolution and ID arbitration. Ultimately, the framework can theoretically support up to 110 nodes on a single physical bus, allowing it to scale across an entire facility floor.
- Integration with IoT Gateways: By interfacing an ESP32 or a similar Wi-Fi/Ethernet co-processor with the central Diagnostic Node, critical alerts can be securely bridged to an external cloud dashboard without exposing the secure CAN bus directly to the internet.
- Predictive Maintenance Algorithms: Rather than solely reacting to explicit hardware faults, the Python telemetry GUI can be upgraded with machine learning algorithms to analyze historical RPM-to-Temperature cooling degradation patterns, effectively predicting fan or compressor failures before they escalate into critical events.
XI.CONCLUSION
This project successfully engineered and implemented an Embedded Real-Time Diagnostic System specifically tailored for mission-critical data center cooling infrastructure. By lever-aging a dedicated Controller Area Network (CAN) and a de-centralized hardware architecture, the system delivers a robust, out-of-band monitoring solution completely immune to primary network outages. Despite initial integration challenges concerning SPI display optimization and CAN bus error states, the finalized prototype effectively processes real-time telemetry, instantaneously propagates hardware-level alerts, and provides an intuitive, touch-based interface for immediate local fault rectification. Ultimately, this architecture significantly enhances the operational resilience of data centers, guarantee-ing that critical thermal management systems remain visible, accessible, and controllable under all adverse conditions.
REFERENCES
- Texas Instruments. (n.d.). Introduction to the Controller Area Network (CAN) (Application Report SLOA101B). https://www.ti.com/lit/an/sloa101b/sloa101pdf
- (2023). Azure Modern Datacenter Cooling [Info-graphic]. Microsoft Datacenters. https://datacenters.microsoft.com/wp-conte nt/uploads/2023/05/Azure_Modern-Datacente r-Cooling_Infographic.pdf
- Texas (n.d.). TivaTM C Series TM4C123G Launch-Pad Evaluation Board User’s Guide (Literature Number: SPMU296).https://www.ti.com/lit/ug/spmu296/spmu296. pdf
- Texas (n.d.). BOOSTXL-K350QVG-S1: Kentec QVGA Display BoosterPack. Product Page. https://www.ti.com/tool/BOOSTXL-K350QVG-S1
- Microchip Technology (n.d.). MCP2515: Stand-Alone CAN Controller with SPI Interface. Datasheet. https://ww1.microchip.com/downloads/en/Dev iceDoc/MCP2515-Stand-Alone-CAN-Controlle r-with-SPI-20001801J.pdf
Recent Comments