
ABSTRACT
The ability to debug a program is a crucial feature of any embedded system. In the early stages of
development, we can use IDEs (such as CCS studio) running on a host machine to debug our
program using tools like JTAG. Even after deployment of the system in the field, it is essential to
monitor the system during its runtime to detect any system failure. It is not possible to connect
the system to suffocated host machines after deployment in most cases.
We can use onboard peripherals like UART to set up a communication medium between the
system and the host in such situations. Using some unique features like the Flash Patch and
Breakpoint unit (FPB), debug monitor interrupt in NVIC provided by ARM CORTEX-M4F
microcontroller implementation of a debug interface is possible through this communication
medium.
This document explores one such debug interface implementation for the Tiva4C(tm4c123gxl)
development board, which uses a UART0 peripheral as a communication medium.
Keywords: Debug, IDEs, deployment, UART, ARM CORTEX-M4F, Flash Patch and Breakpoint unit,
debug monitor interrupt, NVIC, Tiva4C(tm4c123gxl).
INTRODUCTION
This document discusses the implementation of a minimal debugger using ARM CORTEX-M4
debug interrupt and FPB unit. The CCS studio IDE provided by taxes instrumentation(TI) was
used to develop, debug and deploy the program. The program is written in embedded C and uses
some of the libraries provided by TI. The TIVA4C (tm4c123gxl) was the choice for the
development board.
In this document, we try to explain some critical parts of the implementation by referring to the
source code. Understanding the file structure of the program is also crucial. Hence we dedicate
one whole section for the purpose.
This document assumes few prerequisites (listed below) from the reader’s side:
1. Experience with CCS studio or any other embedded system development IDE(its
debugging functions like inserting breakpoint )
2. Basic understanding of C-program compilation and linking (using GNU toolchain for
ARM)
3. Familiarity with openOCD debugger and GDB utility (Follow this link to know more)
4. Understanding of Following cortex m4 peripherals (document do not contain any detailed
discussion on these, but the program heavily relies on these peripherals) :
a. GPIO
b. UART
c. NVIC
5. Understanding of microcontroller startup files (to modify interrupt vector table).
We recommend that the reader revise this prerequisite to get the most out of this document.
The document omits some theoretical background regarding the initialization and working of
ARM cortex debugging architecture.
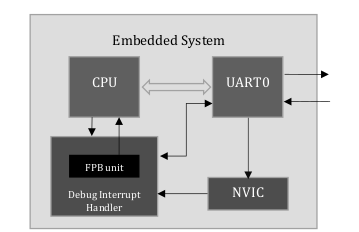
Figure 1 UART Debugger Architecture
UART
The system uses UART0 as a communication medium between the embedded system and
external worlds, which takes user input and displays output using a serial terminal/shell running
on a remotely connected host machine. 115200 is the baud rate for communication. The UART
shell acts as an interface to carry out some basic debugging functionalities like enabling/disabling
debug mode, adding/removing breakpoint at a given memory location, continuing or single-step
execution after hitting a breakpoint.
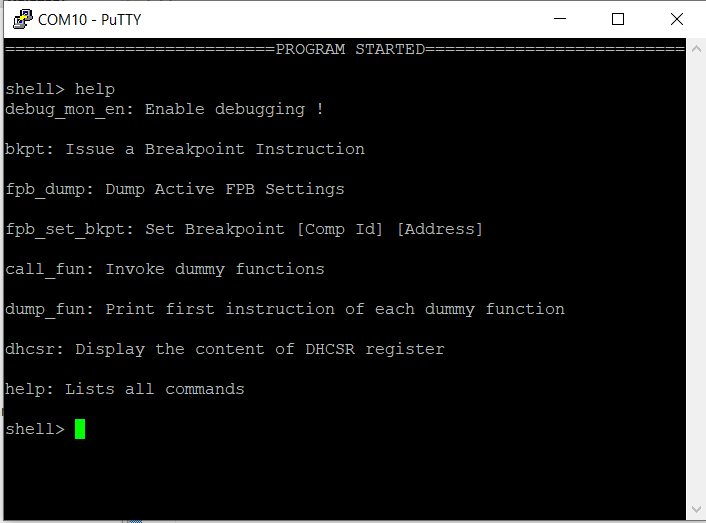
Figure 2 UART shell and its Commands
Figure 2 shows a screenshot of the UART shell. The figure shows that using the “help”
command displays all the available commands in the shell. Whenever required, the discussion
regarding these commands is present in the further sections of the document.
Figure 2 UART shell and its Commands
(NOTE: In our implementation, we are using the shell implementation in the main program
itself. That means we can not debug our main program. For most practical applications, this is
not a desirable situation. To achieve this, one must implement the shell using UART interrupt.
NVIC
Nested Vector Interrupt Controller is used to handle the interrupt in ARM cortex series
microcontrollers. The “debug_mon_en” command initializes all the required NVIC registers to
enable the debug interrupt and set its priority. The command first checks for any previously
enabled debug interrupt by observing the LSB of Debug Halting Control and Status Register
(DHCSR @ 0xE000EDF0). If the command found any previously enabled debug interrupt, it
returns with the message indicating its failure. If there are no previously active interrupts, the
command activates the debug interrupt by appropriately modifying the value of Debug Exception
and Monitor Control Register (DEMCR @ 0xE000EDFC). The command also sets the (lowest
possible) priority of the interrupt by modifying the value of the NVIC_SYS_PRI3_R(0xE000ED20)
register. (To know more about DHCSR and DEMCR, refer [1])
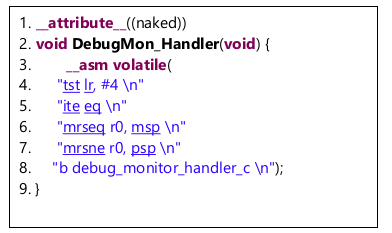
DEBUG ISR
The following code snippet provides a code for ISR. The ISR uses assembly
language commands to set up the stack pointer’s value (lines 6 and 7) and few
critical registers. At the end (line 8), the ISR invokes the
“debug_monitor_handler” function by branching at its location.
The “debug_monitor_handler” provides all the desired functionality to ISR. Figure
3 displays an example output of this function.
In the following example output, the first “bkpt” command is called to set a
breakpoint at the program’s start. This instruction creates a debug interrupt and
invokes debug ISR, which invokes “debug_monitor_handler”
ultimately.
The function prints the values of all the critical CPU and peripheral registers. In
the end, it gives the user a choice to press ‘c’ for continuing the execution of the
program or ‘s’ for executing the program step by step.
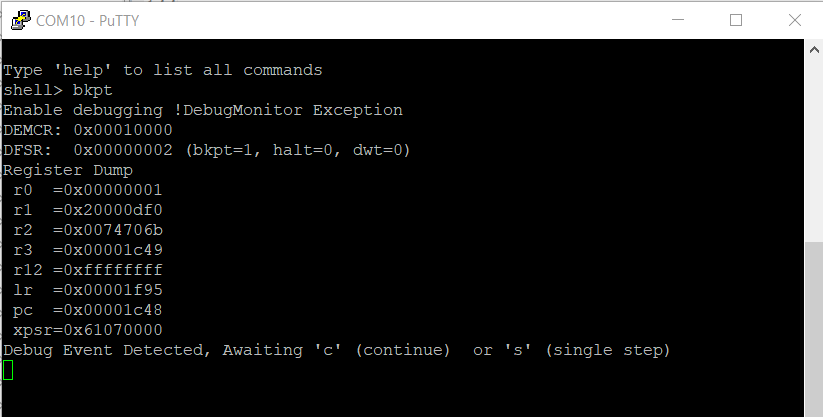
Figure 3 Output of debug_monitor_handler
FPB unit
Breakpoints are an essential part of any debugger system. The breakpoints are classified into two
types, Hardware breakpoints, and Software breakpoints. In most microcontrollers, hardware
breakpoints are limited. In theory, software breakpoints do not have any limitation on their
number. Interested readers can follow the blog “How do breakpoints even works?” by Chris
Coleman to know more about the breakpoint’s work[2].
In our debugger, we implemented six hardware breakpoints with the help of the
Flash Patch and Breakpoint unit. Using FPB, the user can put a breakpoint at any
desiredmemory location.The “fpb_set_bkpt
[index][address]” command provides this functionality. The “fpb_dump” command displays the
status of all the available hardware breakpoints—figure 4 shown a sample
output of the “fpb_dump” command before and after adding a breakpoint.
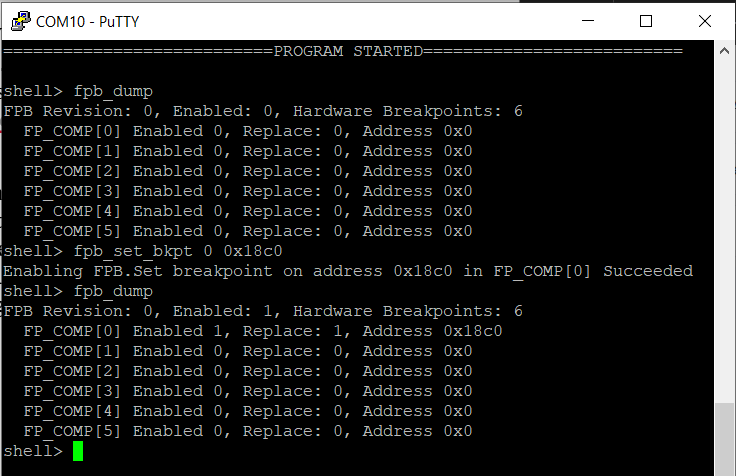
Figure 4 fpb_dump output
The Flash Patch Control Register (FP_CTRL, 0xE0002000) is used to configure the FPB unit.
Figure 5 shows the schematic of the FP_CTRL register.
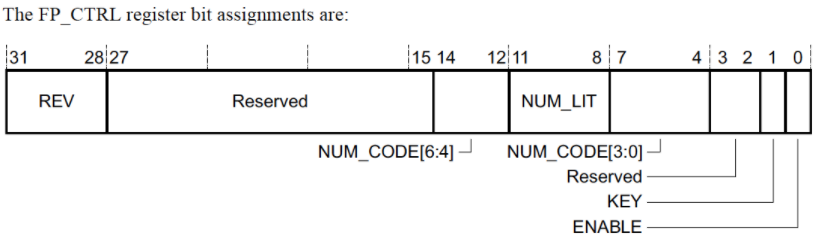
Figure 5 FP_CTRL register
•
REV bits indicate the version of the FPB unites. REV = 0 for version 1 and REV =1 for
version 2.
The number of Available Hardware Breakpoints can be computed by:
FP_CTRL[6:4] << 4 | FP_CTRL[3:0]
•
•
ENABLE turns on the FPB unit when set to 1 and disable when set to 0
The writing to the FP_CTRL register will only take effect if the KEY bit is 1.
The “fpb_set_bkpt” command sets the value of Flash Patch Comparator register (FP_COMPn,
0xE0002008 – 0xE0002008 + 4n) to set the breakpoint. The format of the FP_COMP register
depends on the version of the FPB unit. We are using version 1, so our FP_COMP reg looks like
Figure 6.
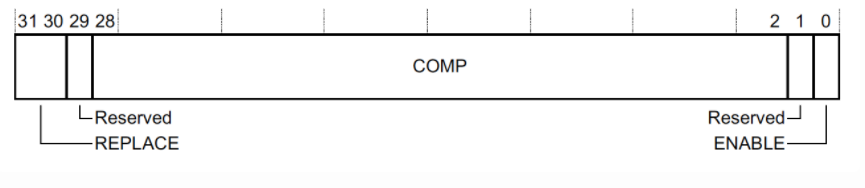
Figure 6 FP_COMP register
The ENABLE = 1 while adding the breakpoint. The REPLACE controls the behavior as follows:
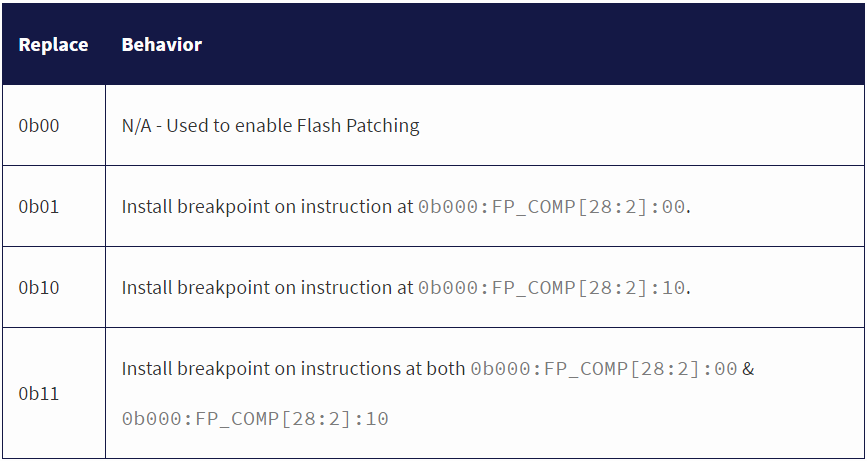
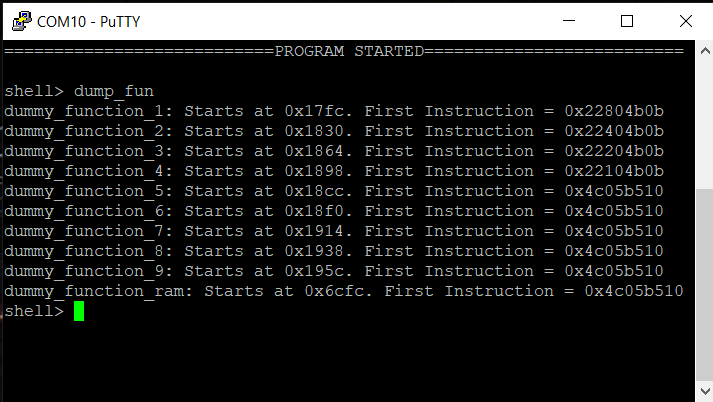
Figure 7 Output of “dump_fun”
DUMMY FUNCTIONS
Our debugger runs in the main program as an infinite loop. It is not possible to debug the main
program using this debugger. To demonstrate the working for the debugger, we include some
dummy functions. This function can be accessed and called through the UART shell commands.
“dump_fun” displays the information about
these dummy functions. Figure 7 shows an
output of the function. The command displays
the starting address of all dummy functions and
the address of their first instruction. We can
use the starting address to add the breakpoint
before the function using the “fpb_set_bkpt”
command.
The dummy_function_1 counts from 0-9 on a
leftmost seven-segment display (present onDUMMY FUNCTIONS
Our debugger runs in the main program as an infinite loop. It is not possible to debug the main
program using this debugger. To demonstrate the working for the debugger, we include some
dummy functions. This function can be accessed and called through the UART shell commands.
“dump_fun” displays the information about
these dummy functions. Figure 7 shows an
output of the function. The command displays
the starting address of all dummy functions and
the address of their first instruction. We can
use the starting address to add the breakpoint
before the function using the “fpb_set_bkpt”
command.
The dummy_function_1 counts from 0-9 on a
leftmost seven-segment display (present on
Figure 7 Output of “dump_fun”
EduARM4
trainer
Board).
Similarly,
dummy_function_2 counts on the second
display, and dummy_function_3 counts on the third display. The rest functions display their
name on the UART shell.
The command “call_fun” will call all the dummy functions sequentially.
(NOTE: Follow this link to view the video demonstration of the debugger program)
ACKNOWLEDGEMENT
We acknowledge the work of Chris Coleman, whose blogs guide us during the development of
this project. Some part of our code is directly borrowed from his git repository[3].
REFERENCES
[1] The Definitive Guide to ARM® Cortex®-M3 and Cortex®-M4 Processors by Joseph Yiu
chapter 15,16.
[2] “How do breakpoints even works?” blog by Chris Coleman
[3] Interrupt git repo
[4] openOCD documentation
[5] GNU gdb documentation
Recent Comments