
Objective
To design a Spectrum Analyzer to work up to frequency of 512Hz using TI Tiva Board TM4c123gxl.
Theory
An audio signal is taken as input from any standard device (laptop, mobile etc) through 3.5 mm jack. Then bias is removed from the signal (and amplify if required) and then it is given to the ADC input of the board. 12 bit binary value is obtained corresponding to 1024 samples that are taken in 1mSec. Then 1024 point FFT is done on this ADC output value. Thus the frequency domain value corresponding to the input audio signal is obtained. Thereafter, the UART terminal is used to send this FFT values to the laptop and display it on the laptop screen as a graph where x-axis is frequency in Hz and y-axis is spectral power value.
Resources
- TIVA microcontroller (TM4C123gxl).
- Eclipse IDE.
- gcc.
- 3.5mm audio jack.
- Capacitor
Taking Audio through 3.5 mm jack
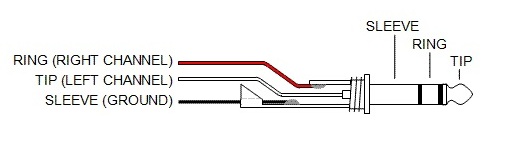
Reference to the above diagram: www.connecthowto.com
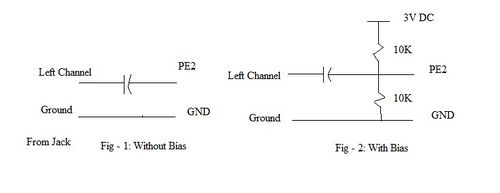
Input is taken through the left channel of this jack. The audio signal is passed from the left channel through an electrolytic capacitor (value around 10microFarad). This will block the DC component and give as input to the Tiva board a signal of magnitude around few hundreds of mV (around 100-200 mV). If the full swing range of the ADC is to be used, then the signal should be amplified to 3V. Again, if it is desired to add certain bias to the ADC input, the circuit in figure 2 below may be used. Now this input is fed to the ADC input via PE2 and GND pins on the board.
ADC Setup
Now the ADC is configured to take 1024 samples of this input signal. Sampling rate is set to 1KHz. 12 bit digital output is thus obtained. Next step is to compute the FFT.
Theory for Fast Fourier Transform
At first, it is important to understand DFT. In Discrete Fourier Transform, discrete data is converted in time domain to discrete data in frequency domain. It is analogous to Fourier transform in continuous time domain. Integration just turns into summation. Now FFT is an efficient way to compute DFT. For this purpose, at first time dissemation of the available time data is done. Then lower-point DFTs are computed for the odd and even sequences separately. Then in certain fashion they are added up to obtain the overall result. For the detailed mathematics please refer to [1]
This procedure for computing FFT has been implemented in C.
Display
The UART0 has been used for console input-output. Every 1mSec, one set of 1024 sample points are taken, then their FFT is computed and 512 spectral points (for one side of the spectrum that corresponds to positive frequency components) are sent through UART and get plotted in GNU Plot. Certain delay is obtained between successive frames of the graph as sampling procedure is not instantaneous.
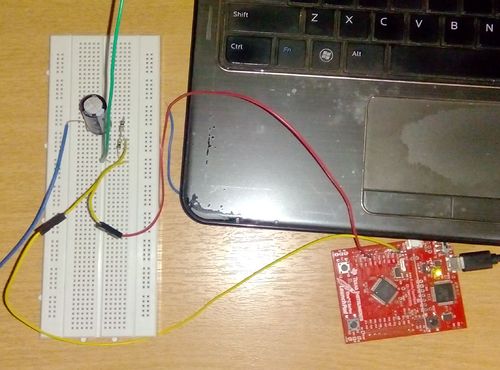
Setup for taking unbiased audio signal as input
Demo
The setup was initially tested for 10Hz to 100Hz sweep range [2]. Then all frequency components of human audible range were used and the setup was tested using 20Hz to 20KHz sweep and got results for up to 512Hz [3]. Finally, the arrangement was tested on a classical guitar track by Vahid Iran Shahi [4]. The video of this test can be found here [5].
Future Work
This setup will be used to implement an instrument tuner. The frequency corresponding to the highest spectral component value will be computed. With certain tolerance, the modified setup will determine which musical note the input sound corresponds to. Like between the frequency range 80Hz to 84.8Hz, C note will get assigned(exact frequency for C note is 82.4Hz). Then the note obtained will get displayed on an LCD Screen.
Group Members
Ayan Chatterjee
Sandipan Sinha
Recent Comments