
Load Your Program
► Load your project to the TM4C123GH6PM flash memory by clicking the Debug button. If you ever want to build the project without loading it, click the HAMMER (Build) button.
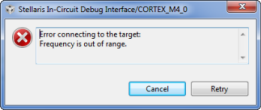
► If you encounter the error shown, your board is disconnected, your power switch is in the wrong position or your drivers are incorrectly installed.
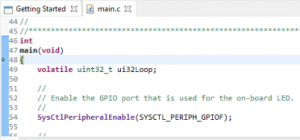
► The program counter will run to main() and stop as shown:
Getting to know the CCS Debug GUI
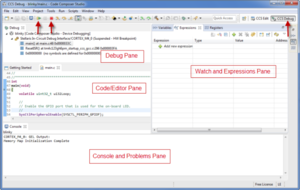
Note the names of the Code Composer panes above. There are two pre-defined perspectives in Code Composer; CCS Edit and CCS Debug. ► Click and drag the tabs (at the arrow above) to the left so you can see both. Perspectives are only a “view” of the available data … you can edit your code here without changing perspectives.
Run your program.
► Click the Resume button or press the F8 key on your keyboard:
The tri-color LED on your target board should blink showing the three colors in sequence. If not, attempt to solve the problem yourself for a few minutes, and then ask your instructor for help.
To stop your program running, ► click the Suspend button.
If the code stops with a “No source available …” indication, click on the main.c tab. Most of the time in the while() loop is spent inside the delay function. That source file is not linked into this project.
Set a Breakpoint
In the code window in the middle of your screen, double-click in the blue area to the left of the line number of the GPIOPinWrite() instruction. This will set a breakpoint (it will look like this: ). Click the Resume button to restart the code. The program will stop at the breakpoint and you will see an arrow on the left of the line number, indicating that the program counter has stopped on this line of code. Note that the current ICDI driver does not support adding or removing breakpoints while the processor is running. Click the Resume button a few times or press the F8 key to run the code. Observe the LED on the LaunchPad board as you do this.
View/Watch memory and variables. 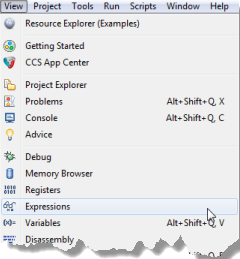
► Select View–>Expressions
► Click on the Expressions tab in the Watch and Expressions pane.
► Double-click on the ui8LED variable anywhere in main().
► Right-click on ui8LED and select:
► Click OK. Right-click on ui8LED in the Expressions pane, and select Number Format Hex. Note the value of ui8LED.
Of course, the ui8LED variable is located in SRAM. You can see the address in the expressions view. But let’s go see it in memory.
► Select View → Memory Browser:
► Type &ui8LED into the memory window to display ui8LED in memory:
View Registers
► Select View → Registers and notice that you can see the contents of all of the registers in your target’s architecture. This is very handy for debugging purposes.
► Click on the arrow on the left to expand the register view. Note that non-system peripherals that have not been enabled cannot be read. In this project you can view Core Registers, GPIO_PORTA (where the UART pins are), GPIO_PORTF (where the LEDs and push buttons are located), HIB, FLASH_CTRL, SYSCTL and NVIC.
Remove all breakpoints
► Click Run –> Remove All Breakpoints from the menu bar or double-click on the breakpoint symbol in the editor pane.
► Breakpoints can only be removed when the processor is not running.
Terminate the debug session
► Click the red Terminate button to terminate the debug session and return to the CCS Edit perspective.
NOTE: Do not use the perspective tabs to move back and forth between perspectives. Clicking the CCS Debug tab only changes the view; it does not connect to the device, download the code or start a debug session. Likewise, clicking the CCS Edit tab does not terminate a debug session.
Only use the Debug and Terminate buttons to move between perspectives.
Recent Comments