Problem Statement
Design Logic Analyzer as an application to study the interfacing of kentec QVGA touch screen graphics display with TIVA c series launchpad.
Resources
- TIVA C Series Microcontroller (TM4C123GH6PM).
- Kentec QVGA Touch Screen Graphics Display.
- Code Composer Studio IDE.
- GCC.
Project Overview
The project demonstrate the design of portable 4 channel logic analyzer.The 4 channels are sampled and captured for the given time period from user.Then these waveforms are displayed on LCD screen where you can interactively diagnose the waveform of each channel by zoom in or zoom out and also by traversing through the waveform.
Block Diagram
The block diagram of the system is as shown below:
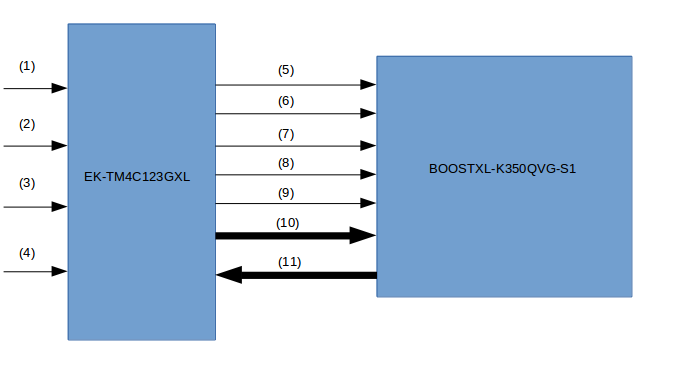
Block Diagram
Description
- Channel 1 input.
- Channel 2 input.
- Channel 3 input.
- Channel 4 input.
- Power supply to Display.
- Ground to Display.
- Reset.
- SPI clock input for LCD.
- Chip select signal input for LCD.
- SPI data input for LCD.
- Resistive touch screen data input for micro-controller.
Understanding GLCD interfacing
Introduction
The BOOSTXL-K350QVG-S1 Kentec QVGA Display BoosterPack is an easy-to-use plug-in module with a touch-screen color display.We can use this BoosterPack to start developing applications using the 320×240-pixel TFT QVGA display with resistive touch screen.It uses SPI for communication.
Key Features
- Kentec TFT LCD (part number: K350QVG-V2-F)
- 3.5-inch QVGA (320×240 resolution)
- SPI communication
- 4-wire resistive touch screen
- White LED backlight
- LED backlight driver circuit
- Complies with the BoosterPack standard for use with 20- and 40-pin LaunchPads.
BOOSTXL-K350QVG-S1 Interface
The pin connections to EK-TM4C123GXL is as shown below in tables.
| J1 Pin | Symbol | Description | Note |
|---|---|---|---|
| 1 | 3.3 V | Power supply | |
| 2 | NC | No connection | |
| 3 | NC | No connection | |
| 4 | NC | No connection | |
| 5 | NC | No connection | |
| 6 | NC | No connection | |
| 7 | LCD_SCL | SPI clock input for LCD | |
| 8 | (LCD_SDC) | 4-wire SPI mode DC input for LCD | |
| 9 | NC | No connection | |
| 10 | NC | No connection |
| J2 Pin | Symbol | Description | Note |
|---|---|---|---|
| 11 | TOUCH_YN | Resistive touch screen terminal (Bottom) | |
| 12 | NC | No connection | |
| 13 | LCD_SCS | Chip select signal input for LCD | |
| 14 | NC | No connection | |
| 15 | LCD_SDI | SPI data input for LCD | * |
| 16 | RESET | Reset signal for MCU | |
| 17 | NC | No connection | |
| 18 | NC | No connection | |
| 19 | NC | No connection | |
| 20 | GND | Ground |
| J3 Pin | Symbol | Description | Note |
|---|---|---|---|
| 21 | 5V | Power Supply | |
| 22 | GND | Ground | |
| 23 | TOUCH_YP | Resistive touch screen terminal (Top) | |
| 24 | TOUCH_XP | Resistive touch screen terminal (Left) | * |
| 25 | NC | No connection | |
| 26 | NC | No connection | |
| 27 | NC | No connection | |
| 28 | NC | No connection | |
| 29 | NC | No connection | |
| 30 | NC | No connection |
| J4 Pin | Symbol | Description | Note |
|---|---|---|---|
| 31 | TOUCH_XN | Resistive touch screen terminal (Right) | |
| 32 | LCD_RST | Reset signal input for LCD | |
| 33 | NC | No connection | |
| 34 | NC | No connection | |
| 35 | NC | No connection | |
| 36 | NC | No connection | |
| 37 | NC | No connection | |
| 38 | NC | No connection | |
| 39 | NC | No connection | |
| 40 | LED_ON/OFF | LCD backlight ON/OFF control. |
- *look into description of EK-TM4C123GXL image
The following are the images of GLCD Display,micro-controller and their interface.
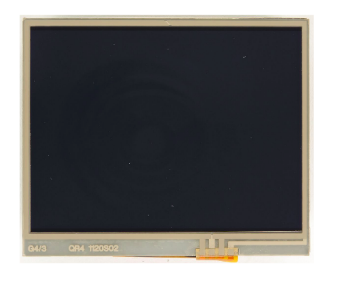
BOOSTXL-K350QVG-S1
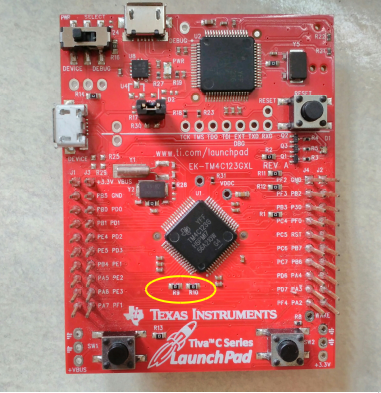
EK-TM4C123GXL:The yellow circle highlights the R9 and R10 registers.This registers should be removed because for the Tiva C Launchpad / EK-TM4C123GXL application, “LCD_SDI / PB7”has been connected to “TOUCH_XP/PD1” by “R10” on the Launchpad.You must remove “R10” before application
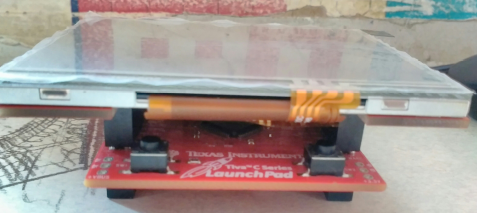
Interfacing:LCD is mounted on controller
Implementation
- Firstly,interface the GLCD display with the TIVA C series launchpad as mentioned above.
- Once the GLCD is interfaced now we have to provide channels for user to probe the digital signals.We have given four GPIO pins for channels.
- Now we need to get the time period for which waveforms should be captured.
- For the given time period we have to sample the channels and store the data in memory.
- Now we have the data of each channel so we can display it.
- We have to write callback functions for the various functionality which we provide though the resistive touch screen.
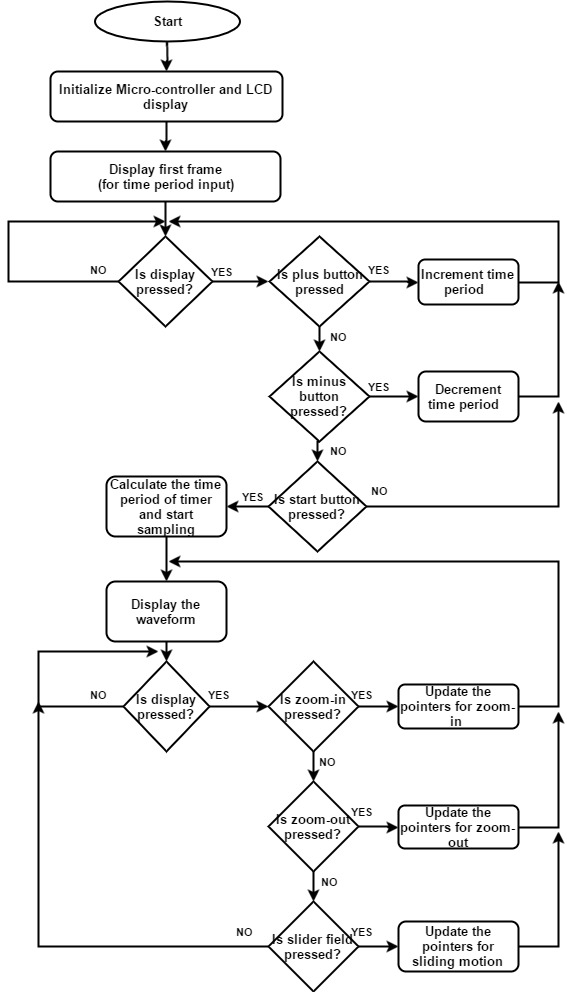
- The flow chart gives the brief idea of the various functionality which is provided using resistive touch screen.
Sampling Frequency
- The maximum frequency which we could achieve is 200KHz.
Flow Chart
The whole flow of program is given below in the flow chart.Once the analysis is done and if we want to capture the waveforms again then we have to reset the system.
Problems faced
The boosterpack which is available is designed various Tivaware launchpads.So when we interfaced the GLCD display with EK-TM4C123GXL and run the example codes everything was fine except the touch.The touch was not working.The calibration was not right so,we need to recalibrate the touch as it was giving wrong values for the cordinates of the screen where we touched the display.
Demo and Code
The demo is uploaded in the YouTube channel.It demonstrate the working of the logic Analyzer.The link for video is below.
Logic Analyzer using BOOSTXL-K350QVG-S1 and EK-TM4C123GXL - https://www.youtube.com/watch?v=oQtkA_8_9hM&feature=youtu.be
This is the link for source code - https://github.com/nileshbu7/Logic-Analyzer
Future Scope
- The Sampling frequency can be improved to increase the resolution of the system.
- The number of channels can be increased if display size is increased.
- Additional functionality can also be added like markers, etc.
- Memory allocation for each channel can be increased so as to store waveforms for longer duration.
References
- BOOSTXL-K350QVG-S1 QVGA Display BoosterPack™ Plug-in Module – http://www.ti.com/lit/ug/slau601a/slau601a.pdf
- BoosterPack (BOOSTXL- K350QVG-S1) – http://www.kentecdisplay.com/uploads/soft/Products_spec/BOOSTXL-K350QVG-S1_UserGuide_04.pdf
- TivaWare™ Peripheral Driver Library (User Guide)
- Tiva™ TM4C123GH6PM Microcontroller(Datasheet)
- Tiva™ C Series TM4C123G LaunchPad Evaluation Board(User’s Guide)
- TivaWare™ Graphics Library(User’s Guide) –http://www.ti.com/lit/ug/spmu300d/spmu300d.pdf
- TivaWare ™ Graphics Library Display Drivers –http://www.ti.com/lit/an/spma055/spma055.pdf
Team Members
Akshay Birari.
Nilesh Upadhye.
Recent Comments