
I.INTRODUCTION
1.1 Background
In recent years, the field of biomedical instrumentation has witnessed a surge in the demand for portable, cost-effective, and user-friendly health monitoring devices. One of the most critical parameters for assessing respiratory and cardiovascular health is blood oxygen saturation (SpO2) and heart rate (BPM). These two indicators are vital for detecting conditions such as hypoxemia, cardiac arrhythmias, and other related abnormalities.
Pulse oximetry is a non-invasive method that allows continuous monitoring of these parameters without the need for specialized clinical settings. With the advent of affordable microcontrollers and highly integrated sensor modules, it is now feasible to design compact pulse oximeter systems that can be deployed in home-based or resource-constrained environments.
1.2 Motivation
The global COVID-19 pandemic, along with a growing emphasis on remote healthcare and telemedicine, has amplified the need for portable diagnostic tools. Many individuals, particularly in rural or isolated areas, lack regular access to healthcare infrastructure. In such contexts, a reliable and standalone pulse oximeter can serve as a preliminary screening tool to monitor vital health parameters and signal the need for medical attention. The goal is to develop a
working prototype of a pulse oximeter system that is low-cost, rechargeable, easy to use, and capable of delivering real-time alerts based on physiological thresholds.
1.3 Principle of Operation
The underlying working principle of the portable pulse oximeter is based on Photoplethysmography (PPG), a non-invasive optical measurement technique that detects blood volume changes in the microvascular bed of tissue. It relies on the principle that the amount of light absorbed by body tissues varies with the pulsing of blood due to cardiac activity. This phenomenon is exploited to calculate both the oxygen saturation level in the blood (SpO2) and the
heart rate (BPM).
The primary sensing component used in this project is the MAX30102 sensor, which integrates two light-emitting diodes (LEDs)—one red (660 nm) and one infrared (940 nm)—and a photodetector aligned in a reflective configuration. These LEDs alternately emit light into the skin, typically at the fingertip or earlobe, and the photodetector measures the intensity of light reflected back through the tissues.
The physiological basis of this method lies in the differing light absorption characteristics of oxygenated hemoglobin (HbO2) and deoxygenated hemoglobin (Hb). Oxygenated hemoglobin absorbs more infrared light and less red light, whereas deoxygenated hemoglobin absorbs more red light and less infrared light. By measuring the intensity of the light reflected at both wave lengths, the system computes the ratio of absorbed red light to infrared light over a pulsatile
cycle.
This ratio, commonly referred to as the ratio-of-ratios, is mathematically correlated with arterial oxygen saturation (SpO2) using an empirically derived lookup table or calibration equation. Simultaneously, the infrared component of the PPG signal exhibits periodic peaks corresponding to each heartbeat. By detecting these peaks and measuring the time interval between them,
the system calculates the heart rate in beats per minute (BPM).
The TM4C123G microcontroller reads the raw photodetector signals via the I2C interface and processes them in real time using a sequence of digital filters, peak detection algorithms, and moving averages. The processed SpO2 and BPM values are then output to the user via a TFT LCDdisplay. Additionally, safety thresholds are monitored continuously to trigger alerts through a buzzer and LED indicators if abnormal readings are detected, such as SpO2 falling below 90% or heart rate exceeding predefined limits.
Thus, the pulse oximeter employs optical sensing, embedded signal processing, and user feed back mechanisms to provide continuous, real-time monitoring of two critical physiological parameters.
II.LITERATURE SURVEY
2.1 Product Survey
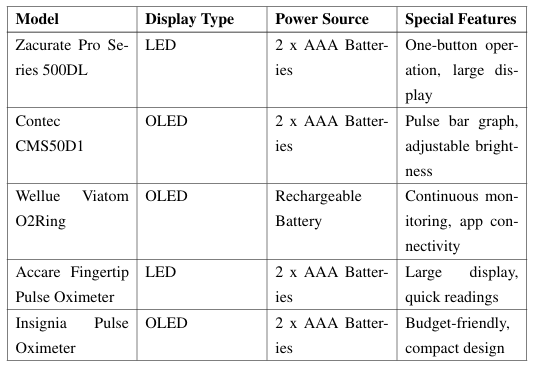
Table 2.1: Comparison of Commercial Pulse Oximeters
2.2 Literature Survey
Photoplethysmography (PPG)
Photoplethysmography (PPG) is a non-invasive optical technique that measures volumetric changes in blood circulation by detecting variations in light absorption through the skin. It is widely used for monitoring heart rate and blood oxygen saturation levels. PPG’s simplicity, cost-effectiveness, and ease of integration into wearable devices make it a popular choice for continuous health monitoring applications.
MAX30102 Sensor Module
The MAX30102 is an integrated pulse oximetry and heart-rate monitor module that combines red and infrared LEDs, photodetectors, optical elements, and low-noise electronics with ambient light rejection. Its compact design and low power consumption make it suitable for wearable and portable applications. The sensor communicates via the I2C interface, facilitating easy integration with microcontrollers for real-time health monitoring.
Signal Processing Algorithms
Accurate determination of SpO2 and heart rate from PPG signals requires robust signal processing techniques. Common approaches include:
• Filtering: Removing noise and motion artifacts using digital filters.
• Peak Detection: Identifying systolic peaks in the PPG waveform to calculate heart rate.
• Ratio-of-Ratios Method: Computing the ratio of AC to DC components of red and infrared signals to estimate SpO2.
Design Implications
Integrating the MAX30102 sensor with the TM4C123GXL microcontroller offers a customizable platform for developing a portable pulse oximeter. The open architecture allows for:
• Tailored signal processing to improve accuracy.
• User interface enhancements through TFT displays.
• Implementation of alert systems for abnormal readings.
This combination facilitates the creation of a cost-effective, reliable, and user-friendly device suitable for both educational purposes and practical applications in remote health monitoring.
III.SYSTEM DESIGN
3.3.1 Block Diagram
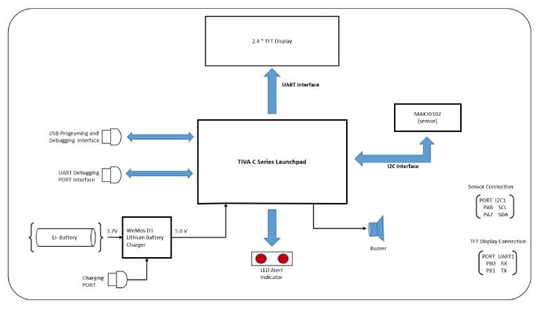
Figure 3.1: System Block Diagram of the Pulse Oximeter and Heart Rate Monitor
3.3.2 Component Description
3.3.2.1 MAX3012
The MAX30102 sensor forms the core sensing element of the system. This high-precision optical sensor uses:
• Red (660nm) and infrared (940nm) LEDs for photoplethysmography
• Integrated photodetector and optimized optics
• I2C communication interface with the microcontroller
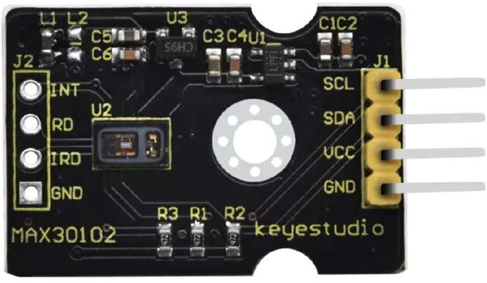
Figure 3.2: MAX30102
3.3.2.2 TIVA
The TM4C123G Launch Pad microcontroller serves as the central processing unit:
• ARMCortex-M4F core running at 80MHz
• Implements signal processing algorithms for SpO2 and heart rate calculation
• Manages communication with the sensor and display
• Controls alert system based on measured parameters
• Handles user interface through GPIO inputs
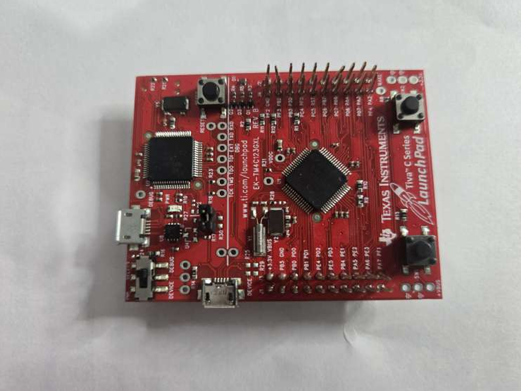 Figure: 3.3 Tiva Launch Pad
3.3.2.3 Display Unit
A2.4-inch TFT display presents measurement results:
• Shows real-time SpO2 values (percentage)
• Displays heart rate measurements (BPM)
• Presents plethysmography waveform in the form of raw IR
• Provides visual indication of measurement status
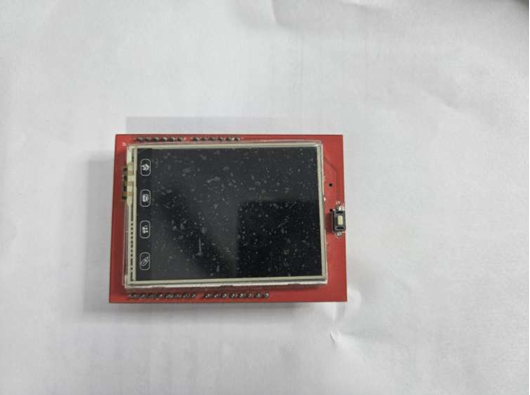
Figure 3.4: TFT Display
3.3.2.4 Alert System
The alert system provides user feedback:
• Red LEDs for visual indication of abnormal readings
• Buzzer for audible alerts when measurements fall outside safe ranges
• Visual indication when SpO2 falls below 90%
• Audio and visual alerts for heart rate outside 60-100 BPM
3.3.2.5 Power Supply
A rechargeable power system ensures portability:
• 3.7V 5Ah Li-ion battery
• Wemos Li battery charger module
• Power management circuitry
• Up to 2.5 hours of operation on full charge
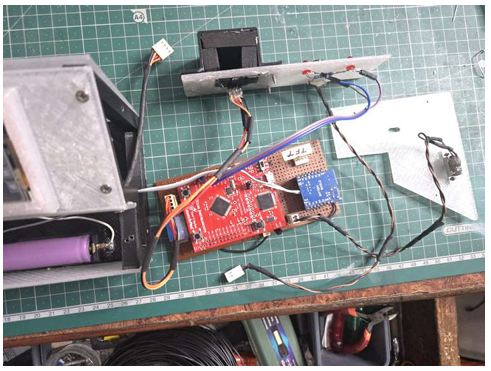
Figure 3.5: Circuit comprising of battery, battery shield and dc-dc converter
3.3 Algorithm
The signal processing algorithm follows these key steps:
1. Sampling: Acquire raw red and infrared (IR) signals from the MAX30102 sensor at 25Hz.
2. Filtering: Apply digital filtering to remove noise and baseline drift.
3. Peak Detection: Identify peaks in the filtered signals corresponding to heart beats.
4. Heart Rate Calculation: Calculate heart rate based on the time interval between peaks.
5. R/IR Ratio: Calculate the ratio of red to infrared signal amplitudes.
6. SpO2 Calculation: Convert the R/IR ratio to SpO2 percentage using a lookup table.
7. Output: Display results and trigger alerts if values fall outside normal ranges.
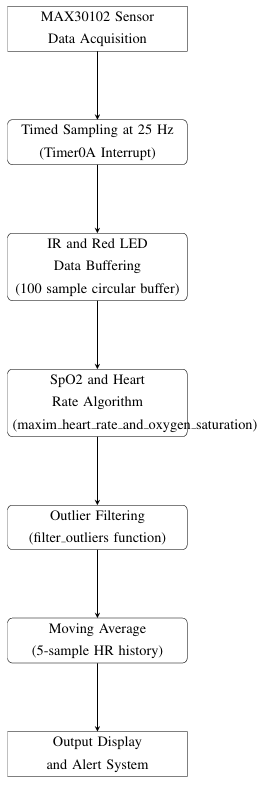
Figure 3.6: Data Processing Pipeline for Heart Rate and SpO2 Monitoring
IV.RESULTS
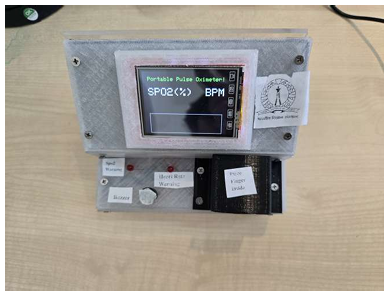
Figure 4.1: TFT Display Initialization and Indicator Panel Setup
Sensor Detection: No Finger Condition
When no finger is placed inside the sensor enclosure, the system detects the absence of IR signal threshold. The display shows the message NO FINGER, and both output readings remain blank. This confirms proper idle-state detection and avoids false triggering.
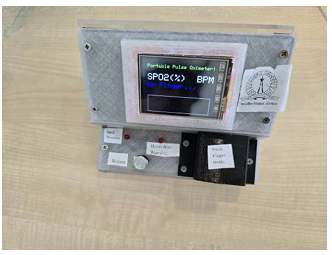
Figure 4.2: System Output When No Finger is Detected
Finger Detected: Measurement in Progress
As soon as the finger is placed inside the enclosure, the system detects sufficient IR light reflection, and sampling begins. The message Pls wait… is displayed while buffers are filled with initial data samples.
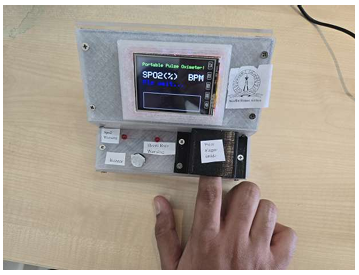
Figure 4.3: Finger Detected– Data Acquisition Started
Stable Measurement Output
After a few seconds of data acquisition and processing, stable values for SpO2 and BPM are displayed. The readings shown in Figure 4.4 are consistent with commercial pulse oximeters, indicating successful algorithm execution. Additionally, the red waveform (raw IR data) is plotted in real time.
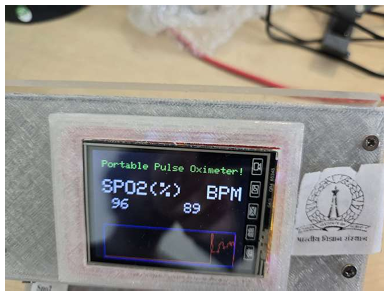
Figure 4.4: Stable Measurement Values with SpO2 and BPM
V.CONCLUSION
The mini project titled ”Design and DevelopmentofaPortablePulseOximeterUsingTM4C123G Microcontroller” has successfully demonstrated the application of embedded systems in real time biomedical signal acquisition and monitoring. The prototype was able to accurately measure and display oxygen saturation (SpO2) and pulse rate (BPM) using the MAX30102 sensor, supported by an algorithm running on the TM4C123G microcontroller. The inclusion of a TFT display for visualization and a buzzer and LED system for alerts further improved user interaction and real-world utility.
Challenges Faced
During the course of development, several challenges were encountered and overcome:
• Sensor Calibration: Ensuring consistent readings from the MAX30102 under varying finger positions and ambient lighting required careful threshold tuning and software filtering.
• Noise and Motion Artifacts: Filtering out noise and artifacts introduced by finger motion was non-trivial, especially with limited processing power.
• Power Management: Designing as table and portable battery-powered system that could run reliably with a 3.7V Li-ion battery and a boost converter introduced practical constraints in terms of voltage regulation and load balancing.
• Real-time Display and Processing: Balancing real-time signal processing with terrupted TFT display updates on a resource-constrained microcontroller required optimized coding practices.
Despite these challenges, the final implementation proved robust and functionally accurate for basic monitoring tasks.
Future Scope
While the current system provides a functional and educational proof-of-concept, several enhancements can be pursued in the future:
• Wireless Connectivity: Integration of Bluetooth or Wi-Fi modules can allow data transmission to smartphones or cloud platforms for remote health monitoring.
• Data Logging: Storing historical data in onboard EEPROM or SD card would support trend analysis and long-term monitoring.
• Advanced Algorithms: More sophisticated signal processing techniques such as adaptive filtering or machine learning-based classification could improve accuracy under noisy conditions.
• Compact Enclosure: A more refined 3D-printed enclosure can improve ergonomics and aesthetics for wearable applications.
• Multi-parameter Sensing: Additional sensors (e.g., temperature, ECG) can be integrated to expand the diagnostic capabilities of the system.
Recent Comments