
ABSTRACT
During development phase of an embedded system, debugger is an important tool to find bugs and monitor
unintended behavior. This functionality is usually enabled by using standard JTAG interface with the help of
IDEs like CCS. However, after deployment of the system, in a remote environment, in order to monitor the
system behavior during runtime, it may not be always possible to connect to a host machine.
We can make use of onboard system peripherals like UART to communicate with host machine. Onboard
debug assist features like FPB (Flash Patch and Breakpoint unit), DWT (Data Watch-point and Trace unit) and
NVIC (Nested Vector Interrupt Controller) can used to create a debug interface and communicate through
UART. This document explores implementation of such a debug interface, which can perform following debug
tasks.
1.Installing a breakpoint.
2.Enabling continue or single stepping mode of execution after hitting a breakpoint.
3.Installing a watch point to a memory location.
4.Poking into a memory location.
IMPLEMENTATION
Debug exception available in cortex M4 enables us to perform debug operations without halting the core.
Systems where halting the core causes subsystem to get into fault cannot be debugged in halting mode.
Hence debug exception is used, where it is given lowest priority so that it can be preempted by other system
interrupts and system will be running.
Debug exception can be triggered by any of the following events.
1. Hitting a breakpoint.
2. Single stepping.
3. Hitting a watch point.
Disabling Halt mode:
.
Monitor mode debug is enabled only if halting
mode is disabled. This can be done by clearing the
C_DEBUGEN bit in the DHCSR register. This
was done using GDB command interface.
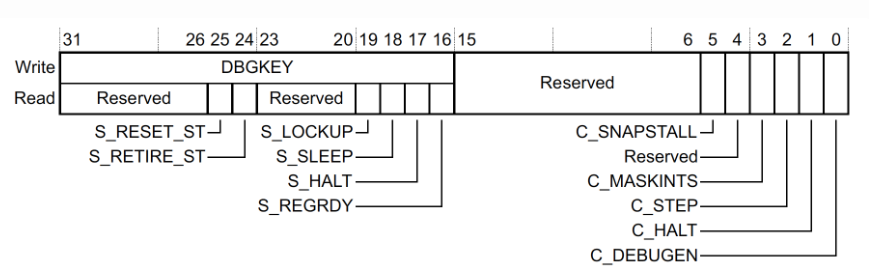
Debug halting control and status register (DHCSR)
Enabling monitor mode:Debug monitor can be enabled by writing 1 to Mon_en bit in DEMCR register.
Step mode can be enabled by writing 1 to Mon_step bit in DEMCR register.
Debug_monitor function does the above functionality.
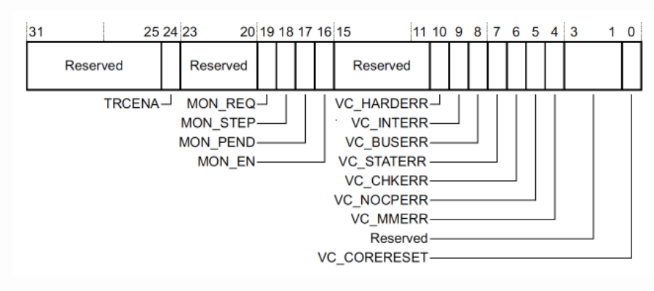
Debug Exception and Monitor Control register (DEMCR)
FPB registers:
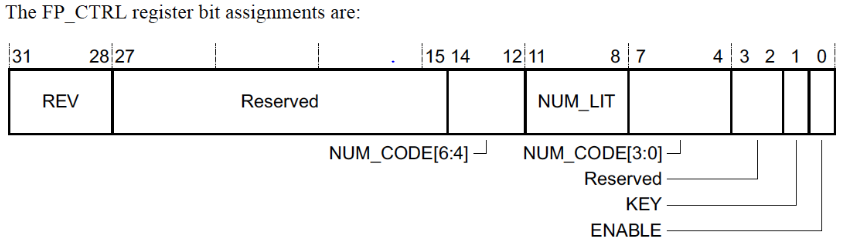
FP_CTRL register:
FP_CTRL register enables FPB unit and description of its fields are as follows.
1. REV: Determines revision of FPB being used and accordingly structure of FPB register varies. TIVA4c
board uses revision 1.
2. Available Breakpoints : Number of available breakpoints can be computed by
FP_CTRL[6:4] << 4 | FP_CTRL[3:0]
3. ENABLE: This field is used to enable FPB when set and disable when reset.
Any changes to FPB_CTRL register takes place only when KEY field is set.
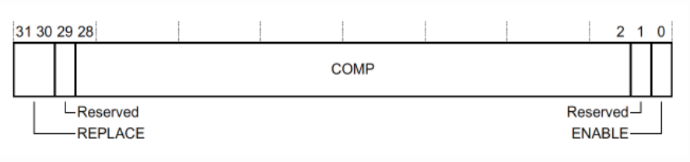
FP_COMP register:
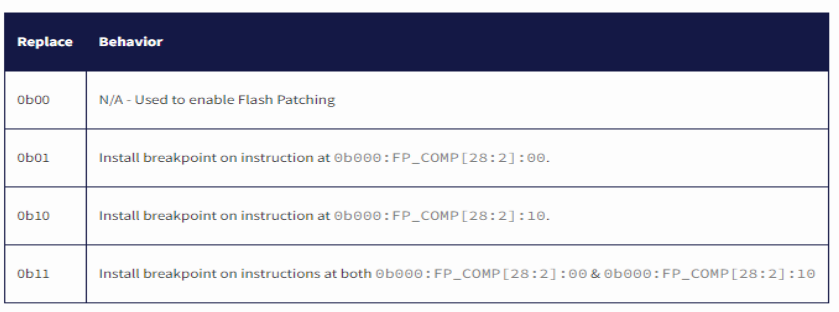
The address at which breakpoints are to asserted are stored in register FP_COMP. Address [28:2] is written in
FP_COMP[28:2] . Address[1:0] is determined using “replace” field as per table given below.
Debug_monitor_enable function enables FPB by writing enable to FPB_CTRL register. Set_breakpoint function writes
address at which breakpoint is to be enabled to FPB_COMP register.
DWT registers
DWT_CTRL:
Number of hardware watch-points available can be determined using NUMCOMP field in DWT_CTRL register.
DWT_FUNCTION:
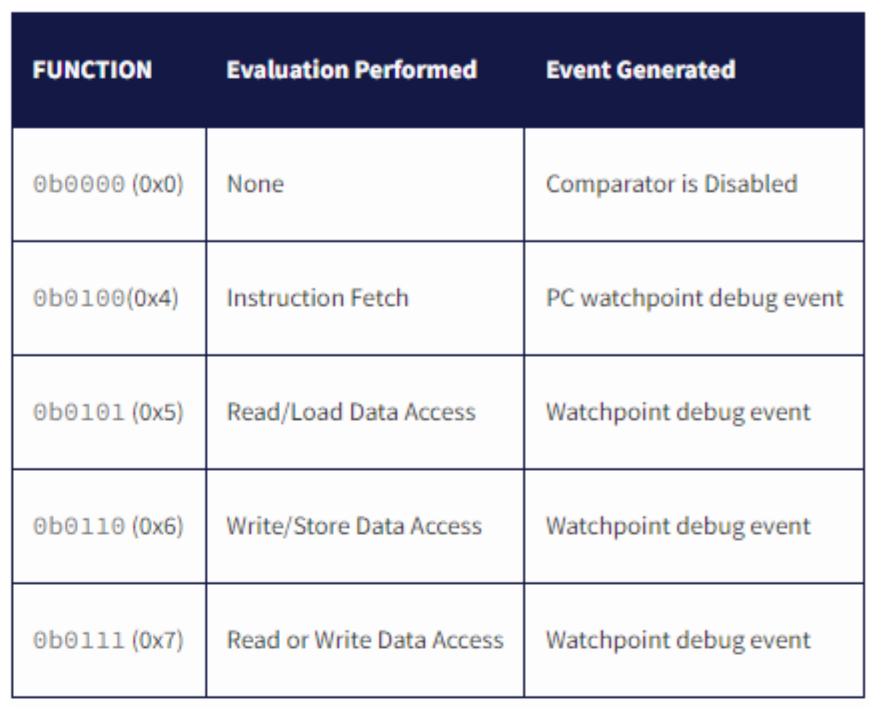
The description of its field are as follows:
1. FUNCTION: This field determines type of access upon which watch point is triggered. The following table lists
type of access available.
2. MATCHED: This field is set if there is a match since the last time register is read. This is used in debug ISR to
determine which watch point triggered exception and correspondingly value at that address is displayed on
UART.
DWT_COMP:
The address at which watch point is to be set is stored in DWT_COMP register.
DWT_MASK:
The setting in the DWT_MASK defines the number of bits to ignore when performing a comparison. So the
number of locations to be matched by hardware is determined by DWT_MASK.
Set_watchpoint function writes appropriate function (type of access) to DWT_FUNCTION register and address
to be matched to DWT_COMP_ register. Here we have used mask to be 0 i.e., match only 1 memory location.
Debug ISR Assembly:
Upon encountering a debug event, this ISR is executed, which is written in assembly code. The stack frame at
that instant of event is copied on to a structure called “ContextStateFrame”. By checking link register, MSP or
PSP is determined accordingly. This stack frame is passed to the debug handler which is written in C.
Debug ISR C:
This debug handler takes stack pointer from assembly debug handler and prints stack frame onto UART. This
handler checks whether it is triggered by watch point, breakpoint or step mode using flag register DFSR.
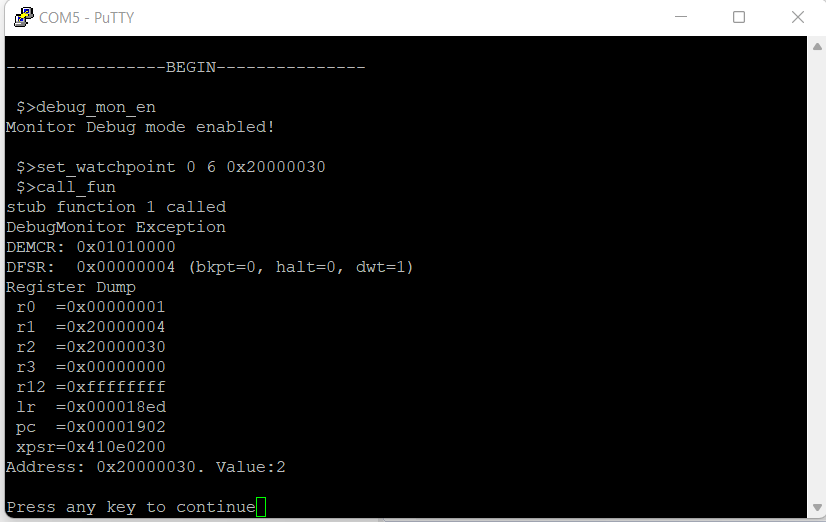
Upon Watch point:
It accesses the value at address which triggered watch point and waits for user input to continue program flow.
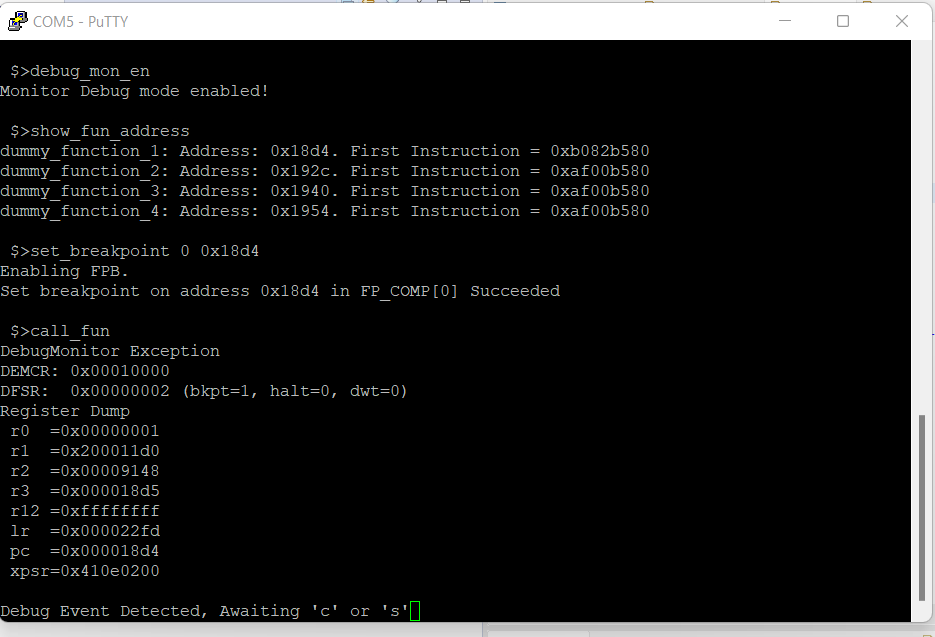
Upon Breakpoint:
Stepping over a breakpoint is a several step process:
1. If it’s a bkpt instruction, we need to advance the program counter by the size of the instruction (2
bytes).
2. If a bkpt event was generated from a breakpoint configured in the FPB, we need to:
o Disable the FPB. Otherwise, any attempt to continue will just hit the breakpoint again.
o Single-Step one instruction.
o Re-enable the FPB and disable single-stepping in order to resume program execution.
UART:
UART is used for communication. All the commands to be executed and the results to be printed on screen are
sent through UART peripheral. Communication is interrupt driven. By giving the command “help”, list of
commands along with its functionality is displayed.
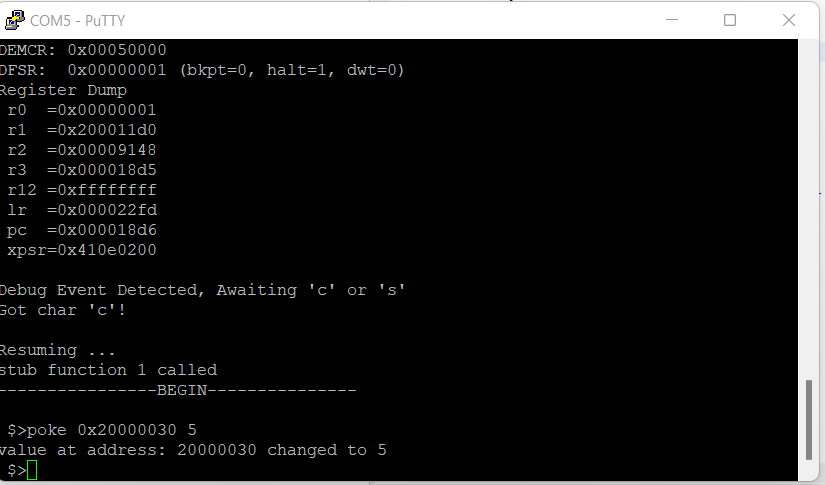
Results:
1. Debug exception executed after encountering a watchpoint.
2. Debug exception executed after encountering a breakpoint.
3. Poking a memory location.
Future Scope:
Mapping from binary to symbol table can be added. Access to symbol table can enhance the features of the
debugger and gives more flexibility to the user in debugging.
References:
[1]. The Definitive Guide to ARM® Cortex®-M3 and Cortex®-M4 Processors by Joseph Yiu chapter 15,16
[2]. “How do breakpoints even works?” blog by Chris Coleman
[3]. “Faster debugging with watchpoints” blog by Chris Coleman
[4]. openOCD documentation.
[5]. GNU GDB documentation.
Code:UART_DEBUGGER
Demo: Uart Debugger
Recent Comments