VSCode Cortex Debugging
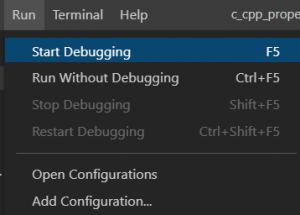
Use F5 or the menu Run > Start Debugging to start a debug session:
This starts debug session. In case of troubles, check the Debug Console:
Debug Console Output
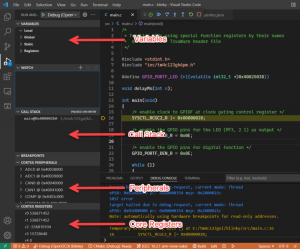
Launching GDB: /opt/toolchains/gcc-arm-none-eabi-10.3-2021.10/bin//arm-none-eabi-gdb -q --interpreter=mi2 /home/jshankar/codeprojects/tm4c123gxl/blinky/build/blinky.elf Set "showDevDebugOutput": true in your "launch.json" to see verbose GDB transactions here. Helpful to debug issues or report problems Reading symbols from /home/jshankar/codeprojects/tm4c123gxl/blinky/build/blinky.elf... Launching gdb-server: /usr/bin/openocd -c "gdb_port 50000" -c "tcl_port 50001" -c "telnet_port 50002" -s /home/jshankar/codeprojects/tm4c123gxl/blinky -f /home/jshankar/.vscode/extensions/marus25.cortex-debug-1.2.0/support/openocd-helpers.tcl -f board/ek-tm4c123gxl.cfg Please check TERMINAL tab (gdb-server) for output from /usr/bin/openocd 0x00000000 in g_pfnVectors () Program stopped, probably due to a reset and/or halt issued by debugger 2 adapter speed: RCLK - adaptive target halted due to debug-request, current mode: Thread xPSR: 0x01000000 pc: 0x00000354 msp: 0x2000021c adapter speed: RCLK - adaptive target halted due to debug-request, current mode: Thread xPSR: 0x01000000 pc: 0x00000354 msp: 0x2000021c adapter speed: RCLK - adaptive target halted due to debug-request, current mode: Thread xPSR: 0x01000000 pc: 0x00000354 msp: 0x2000021c Note: automatically using hardware breakpoints for read-only addresses. Temporary breakpoint 1, main () at /home/jshankar/codeprojects/tm4c123gxl/blinky/src/main.c:16 16 SYSCTL_RCGC2_R |= 0x00000020;By default there are several debug views available. With the .svd file, we have access to the peripheral register too:
Debug Commands
There are the usual debug commands (continue, stepping, restart) plus a run and debug toolbar

- Continue / Pause F5
- Step Over F10
- Step Into F11
- Step Out Shift+F11
- Restart Ctrl+Shift+F5
- Stop Shift+F5
Assembly Stepping
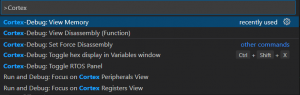
Press CTRL+SHIFT+P to invoke command palette. Then Select Cortex-Debug:View Disassembly(Functon), type the function name you want to disassemble.
-
0x000002ac: 80 b5 push {r7, lr}
-
0x000002ae: 00 af add r7, sp, #0
-
0x000002b0: 0e 4b ldr r3, [pc, #56] ; (0x2ec <main+64>)
-
0x000002b2: 1b 68 ldr r3, [r3, #0]
-
0x000002b4: 0d 4a ldr r2, [pc, #52] ; (0x2ec <main+64>)
-
0x000002b6: 43 f0 20 03 orr.w r3, r3, #32
-
0x000002ba: 13 60 str r3, [r2, #0]
-
0x000002bc: 0c 4b ldr r3, [pc, #48] ; (0x2f0 <main+68>)
-
0x000002be: 0e 22 movs r2, #14
-
0x000002c0: 1a 60 str r2, [r3, #0]
-
0x000002c2: 0c 4b ldr r3, [pc, #48] ; (0x2f4 <main+72>)
-
0x000002c4: 0e 22 movs r2, #14
-
0x000002c6: 1a 60 str r2, [r3, #0]
-
0x000002c8: 0b 4b ldr r3, [pc, #44] ; (0x2f8 <main+76>)
-
0x000002ca: 0e 22 movs r2, #14
-
0x000002cc: 1a 60 str r2, [r3, #0]
-
0x000002ce: 4f f4 fa 70 mov.w r0, #500 ; 0x1f4
-
0x000002d2: 00 f0 13 f8 bl 0x2fc <delayMs>
-
0x000002d6: 08 4b ldr r3, [pc, #32] ; (0x2f8 <main+76>)
-
0x000002d8: 1b 68 ldr r3, [r3, #0]
-
0x000002da: 07 4a ldr r2, [pc, #28] ; (0x2f8 <main+76>)
-
0x000002dc: 03 f0 f1 03 and.w r3, r3, #241 ; 0xf1
-
0x000002e0: 13 60 str r3, [r2, #0]
-
0x000002e2: 4f f4 fa 70 mov.w r0, #500 ; 0x1f4
-
0x000002e6: 00 f0 09 f8 bl 0x2fc <delayMs>
-
0x000002ea: ed e7 b.n 0x2c8 <main+28>
-
0x000002ec: 08 e1 b.n 0x500
-
0x000002ee: 0f 40 ands r7, r1
-
0x000002f0: 00 54 strb r0, [r0, r0]
-
0x000002f2: 02 40 ands r2, r0
-
0x000002f4: 1c 55 strb r4, [r3, r4]
-
0x000002f6: 02 40 ands r2, r0
-
0x000002f8: fc 53 strh r4, [r7, r7]
-
0x000002fa: 02 40 ands r2, r0
It is possible to set breakpoints in the assembly code, but one cannot see high level (C/C++) side-by-side with the assembly code. And the disassembly view does not show any more information or symbolic as the Eclipse CDT disassembly view does.
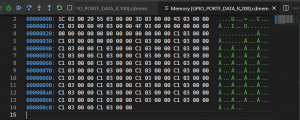
Memory
To view memory, use the Command Palette (CTRL+SHIFT+P) with Cortex-Debug:View Memory.
Then specify the expression for the memory location and a length.
Recent Comments